


EUR/USD
Higher time frames
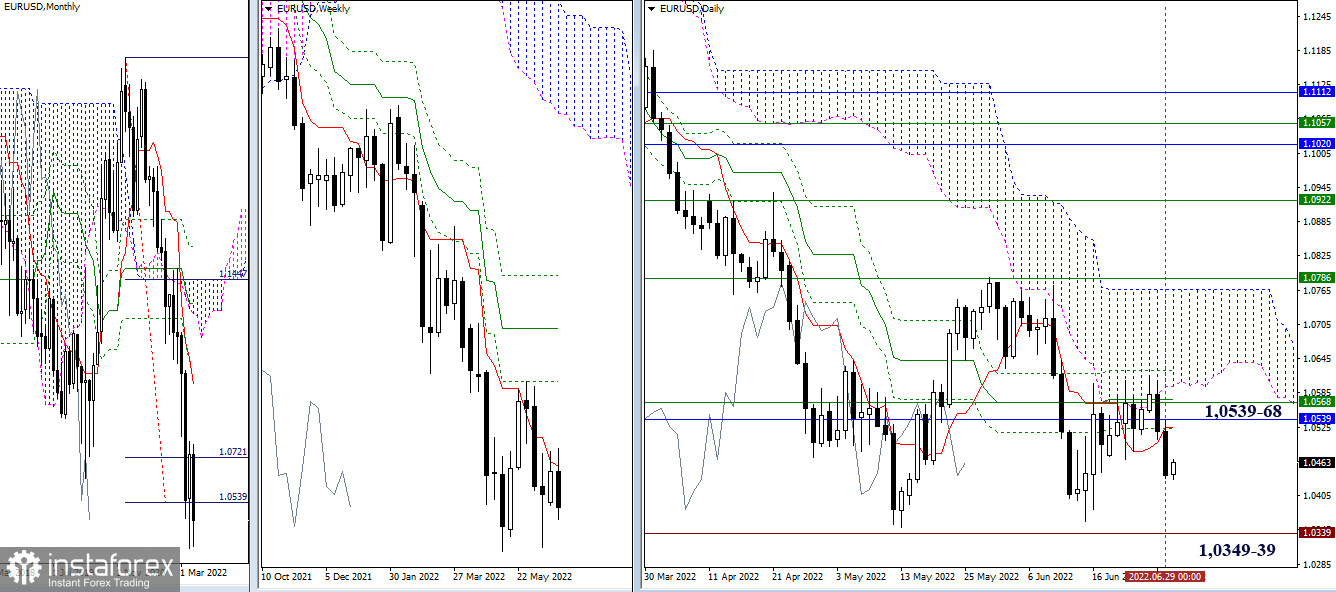
The resistance zone formed by the key levels of 1.0539-68 remained intact and maintained its importance for the market. Yesterday, bears continued to push the pair down to the targets located at the minimum extremum points of 1.0349 and 1.0339. If the price settles firmly below them, the downtrend on higher time frames will resume.
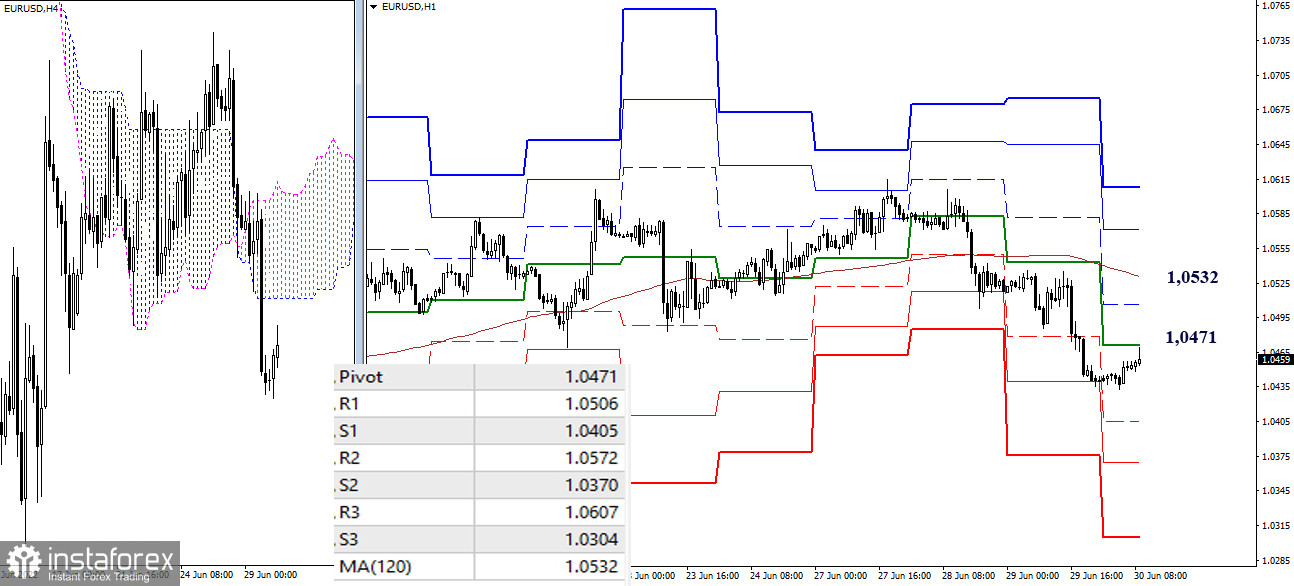
H4 – H1On lower time frames, sellers are developing a downward movement but at the moment, they have entered a corrective phase. They are now testing the resistance at the pivot level of 1.0471. The next key level for a correction on lower time frames is found at 1.0532 (weekly long-term trend). If the price completes the correction, the downtrend on the intraday chart will develop through the support zones located at the pivot levels of 1.0405 – 1.0370 – 1.0304.
***
GBP/USD
Higher time frames
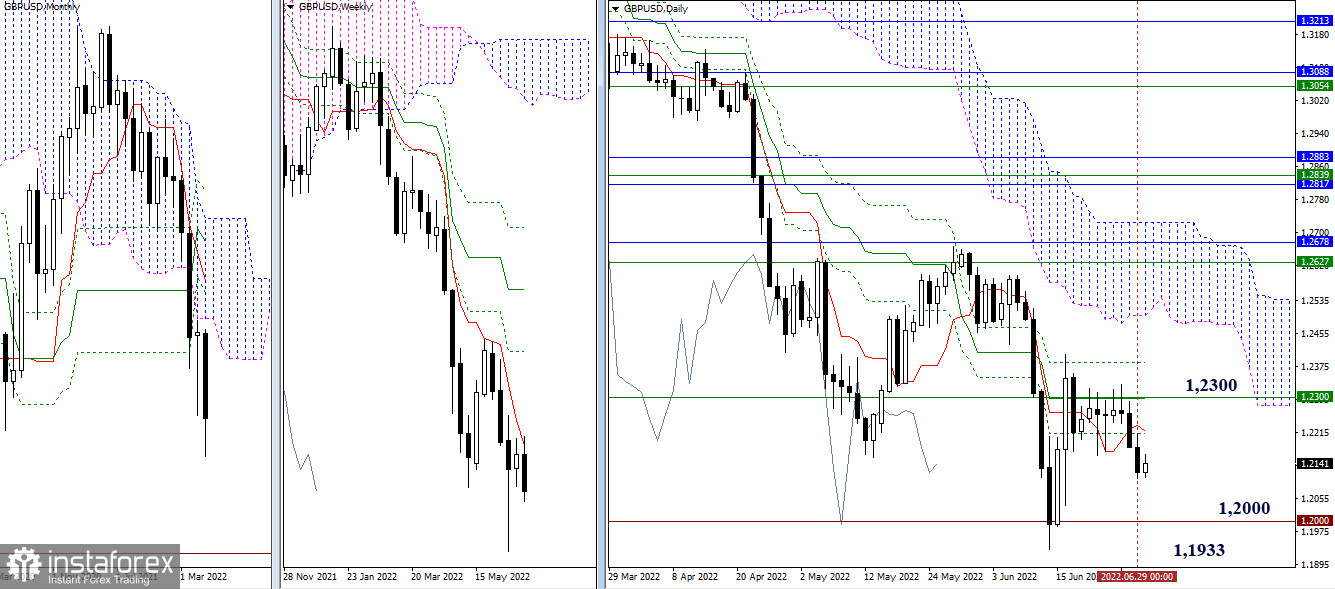
The weekly short-term trend formed at 1.2300 acts as resistance for the current upside correction. Yesterday, sellers continued to develop the downward movement in an attempt to end the corrective rise. If they succeed in doing this, the downtrend on higher time frames will resume. For this, the pair needs to break through an important psychological level of 1.2000 and settle firmly below the low of 1.1933.
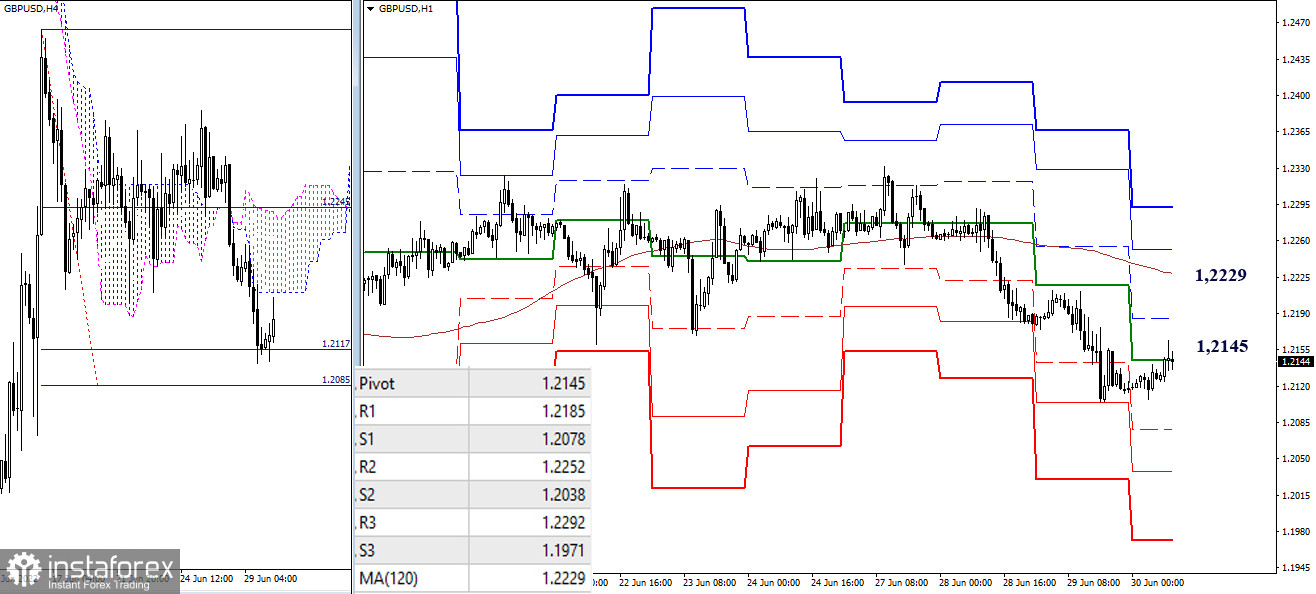
H4 – H1On lower time frames, sellers are in control of the market. However, the downward pressure has already lost its intensity. The pair broke through the lower target of the Ichimoku cloud on H4 located at 1.2117 and initiated a correction. At the moment, the price is testing the central pivot level of 1.2145. In case the pair develops a corrective upside movement, the test of the key resistance on lower time frames (the weekly long-term trend at 1.2229) will be the most important factor to watch as this is where the market balance may change. If bears manage to complete the correction and break through the 1.2085 target on H4, then the next downward targets will be the support zones found at the pivot points of 1.2078 – 1.2038 – 1.0971.
***
Technical analysis is based on:
For higher time frames: Ichimoku Kinko Hyo (9.26.52) + Fibo Kijun levels
For H1: Pivot Points (standard) + 120-day Moving Average (weekly long-term trend)


