


Analysis of Monday's deals:
30M chart of the EUR/USD pair
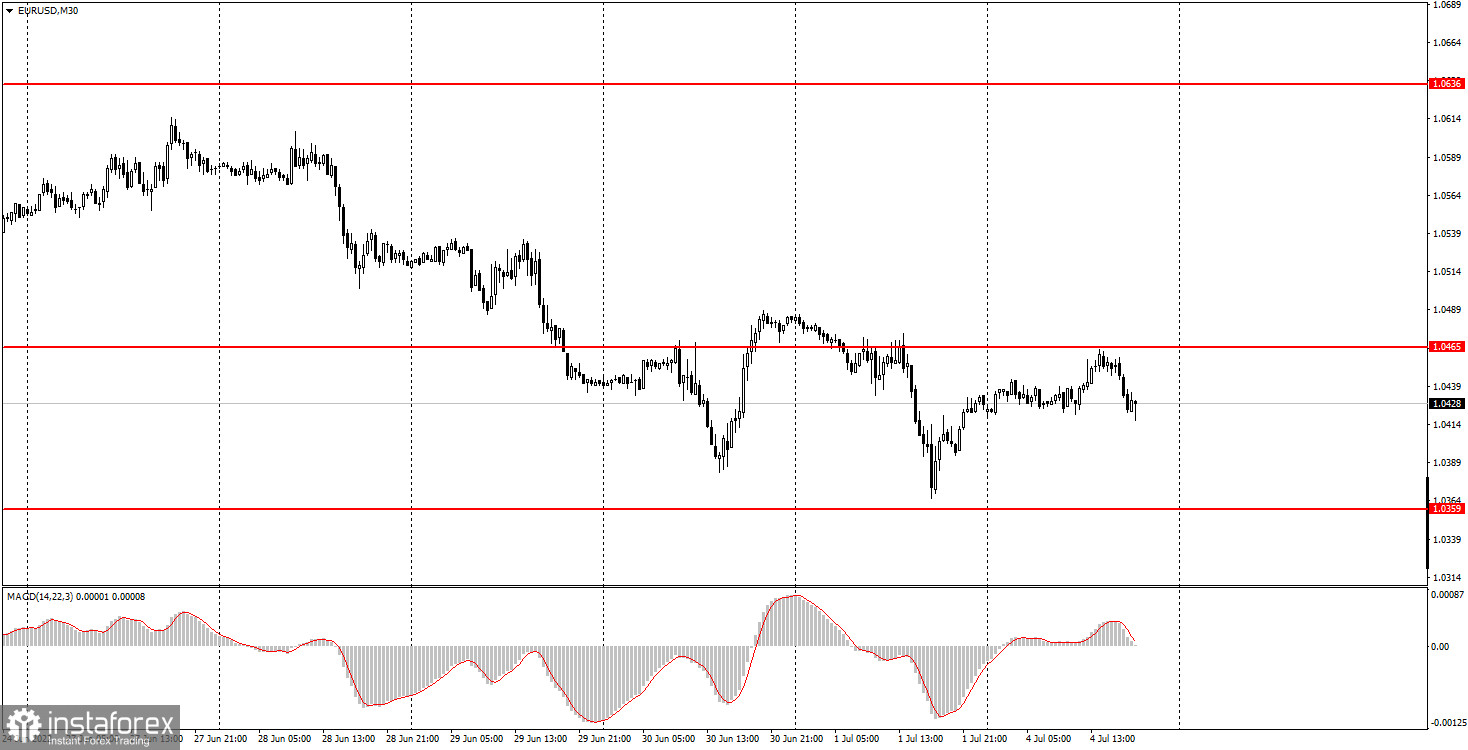
The EUR/USD currency pair stood in one place for most of the day on Monday. This is not surprising, since it was Independence Day in the United States, so most banks and trading floors were closed. However, during the US trading session, we still saw a small surge of emotions, which is a bit strange. It would be much more logical if the pair moved more actively during the European session. But in general, volatility was still quite low, no more than 50 points. Thus, for the entire day, the day went as we had said. No important macroeconomic statistics were published on Monday, so the market had nothing to react to during the day. All the most interesting events for the euro/dollar pair are scheduled for Friday. As for the technical picture, it is still impossible to form a trend line on the 30-minute timeframe. Formally, the pair resumed its downward movement, but on the way to its local and 20-year lows it stopped again and now a further fall is in doubt. We have no doubt that in the medium term the euro will continue to depreciate, but at the same time, this may happen later, and not right now.
5M chart of the EUR/USD pair
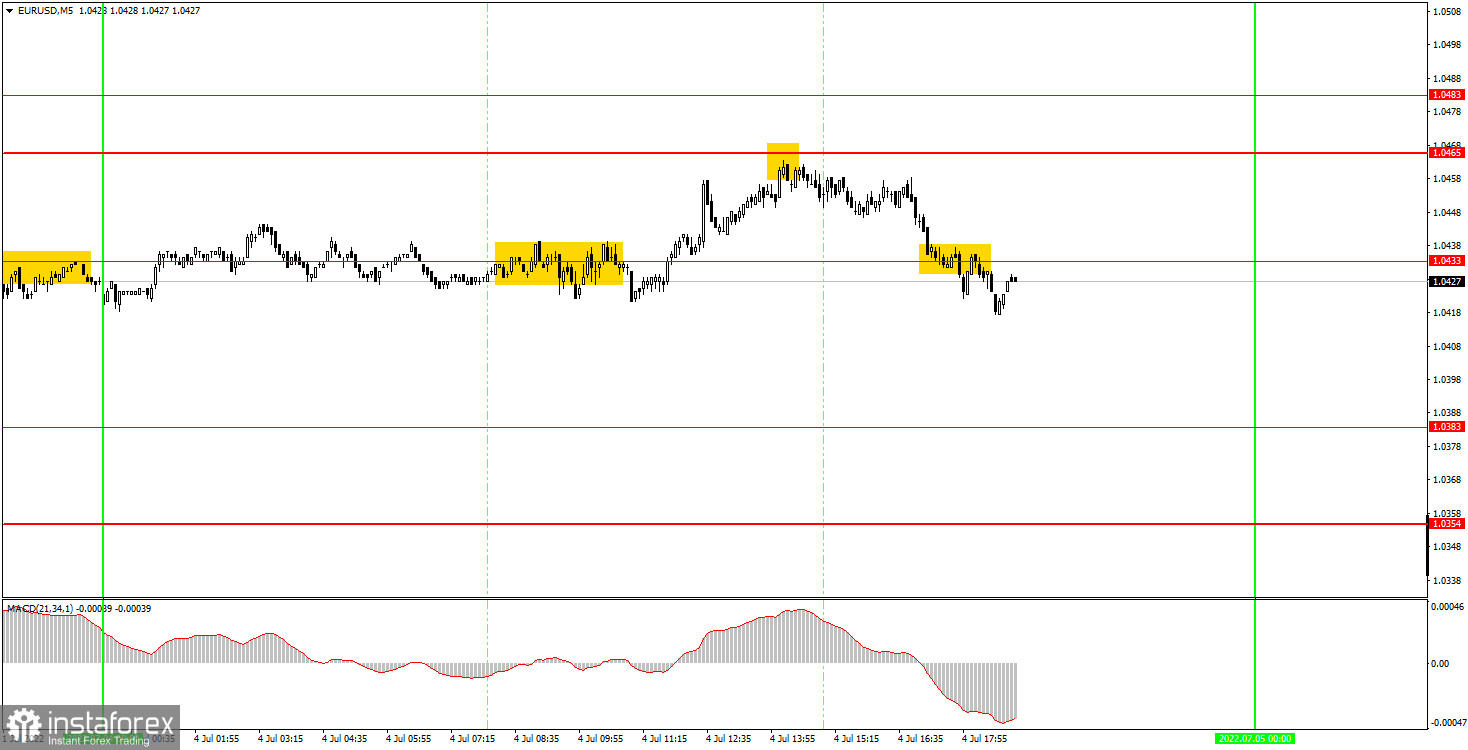
Several trading signals were formed on the 5-minute timeframe. The very first trade signal around 1.0433 was very inaccurate and should have been ignored by traders as the market was flat at the time and we warned yesterday that having no trend was normal for a "half day". Then a sell signal was formed near the level of 1.0465. At the time of its appearance, the pair had already shown a desire to trade with the trend, so this signal could be worked out. The error in its formation was 2 points, which is acceptable. As a result, the price began the necessary decline and even managed to overcome the level of 1.0433. The pair traded just below this level in the evening, so traders had to close the short position manually. Profit on it amounted to 25-30 points. An excellent result for a day when the total volatility was 50 points.
How to trade on Tuesday:
A new downward trend has formed in the 30-minute time frame, but there is still no trend line or channel, which makes trading a little more difficult. There were no changes on the technical picture, and the question regarding the euro's succeeding decline and the timing remains open. There will be a small number of fundamental and macroeconomic events this week, so we will probably see weak, almost flat movements for most of the week. On the 5-minute TF on Tuesday, it is recommended to trade at the levels of 1.0354, 1.0383, 1.0433, 1.0465, 1.0483, 1.0535. When passing 15 points in the right direction, you should set Stop Loss to breakeven. The European Union will publish the index of business activity in the service sector for June, the final value. As the market is already aware of its first estimate, we do not expect a reaction to this report. There will be nothing interesting in the US. Thus, the nature of the pair's movement can be similar to Monday.
Basic rules of the trading system:
1) The signal strength is calculated by the time it took to form the signal (bounce or overcome the level). The less time it took, the stronger the signal.
2) If two or more deals were opened near a certain level based on false signals (which did not trigger Take Profit or the nearest target level), then all subsequent signals from this level should be ignored.
3) In a flat, any pair can form a lot of false signals or not form them at all. But in any case, at the first signs of a flat, it is better to stop trading.
4) Trade deals are opened in the time period between the beginning of the European session and until the middle of the US one, when all deals must be closed manually.
5) On the 30-minute TF, using signals from the MACD indicator, you can trade only if there is good volatility and a trend, which is confirmed by a trend line or a trend channel.
6) If two levels are located too close to each other (from 5 to 15 points), then they should be considered as an area of support or resistance.
On the chart:
Support and Resistance Levels are the Levels that serve as targets when buying or selling the pair. You can place Take Profit near these levels.
Red lines are the channels or trend lines that display the current trend and show in which direction it is better to trade now.
The MACD indicator (14,22,3) consists of a histogram and a signal line. When they cross, this is a signal to enter the market. It is recommended to use this indicator in combination with trend lines (channels and trend lines).
Important speeches and reports (always contained in the news calendar) can greatly influence the movement of a currency pair. Therefore, during their exit, it is recommended to trade as carefully as possible or exit the market in order to avoid a sharp price reversal against the previous movement.
Beginners on Forex should remember that not every single trade has to be profitable. The development of a clear strategy and money management are the key to success in trading over a long period of time.


