


Analysis of Monday's deals:
30M chart of the GBP/USD pair
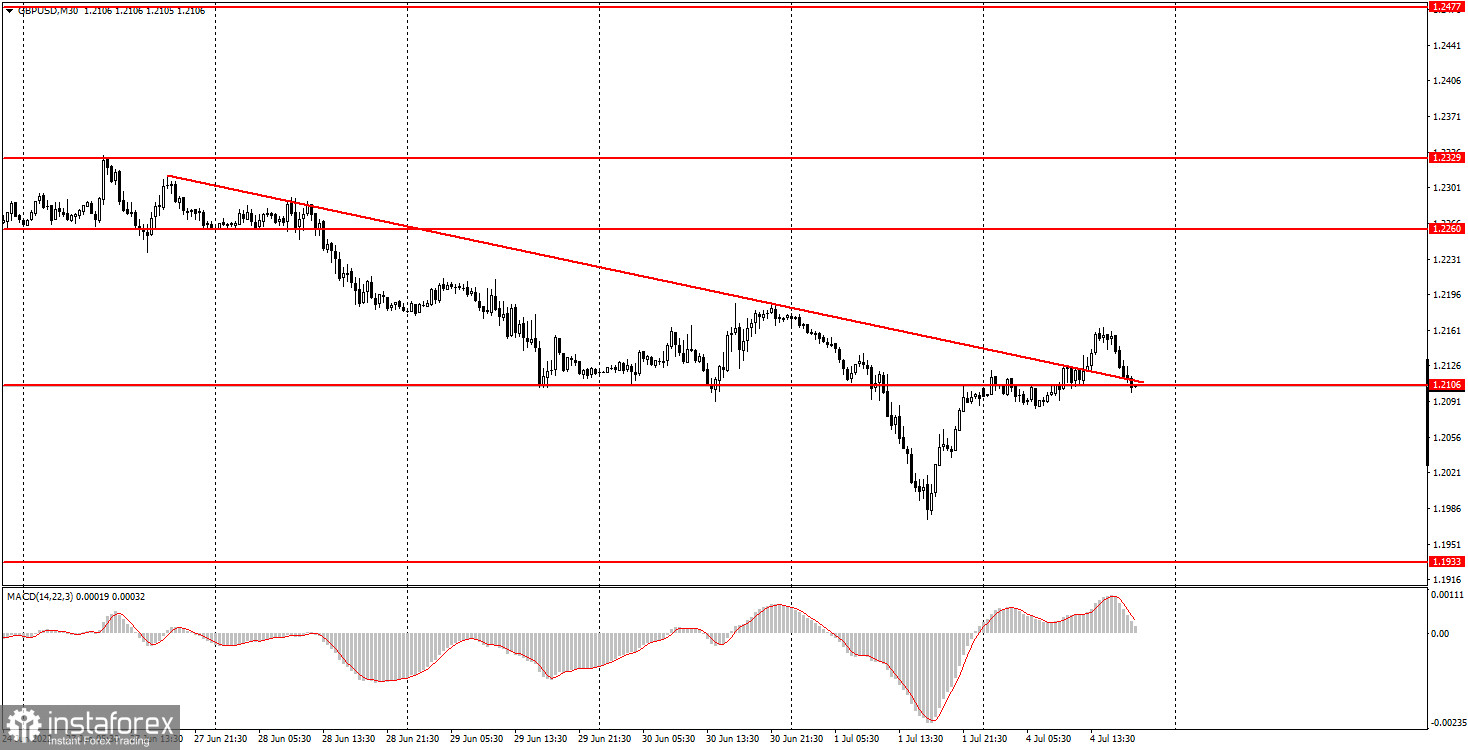
The GBP/USD pair also traded in a rather sluggish manner on Monday due to the fact that this day was actually a "half day". Movement was more active during the US session, but it did not affect the technical picture dramatically. However, the trend line, which was formed literally on Friday, has already managed to cancel. Thus, the pound's succeeding decline is not obvious now. In principle, the situation for the pound continues to be the same as for the euro. The pair crept up to its 2-year lows, but once again failed to overcome them or at least test for strength. Thus, the global downtrend remains relevant, but it may take more time for the fall of European currencies to be resumed in full. Take note that consolidating above the trend line, by and large, does not mean anything. It certainly does not mean that the British currency will now form a new upward trend, as it has obvious problems with growth in recent months. No macroeconomic statistics were published on Monday, and the pair's volatility was 80 points, which is actually not so little.
5M chart of the GBP/USD pair
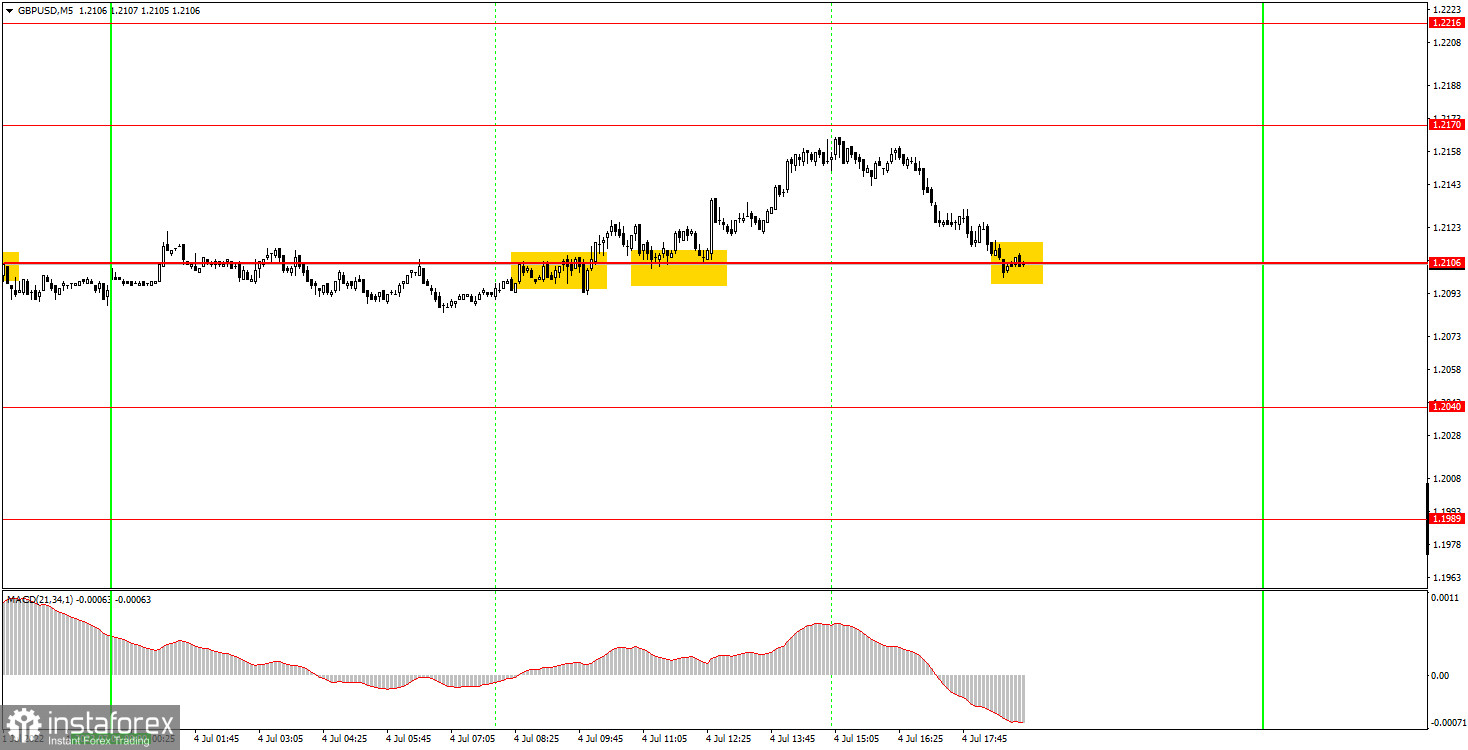
Monday's trading signals were not the worst on the 5-minute time frame. There were several of them, and among them there were practically no false ones, but there were two kinds. For example, the first signal to buy should have been ignored, since at that time the market was flat and there was a high probability that it would continue all day. During the second buy signal, it was also not clear whether the intraday trend movement had begun or not, so it was better to ignore it too. However, the trend movement nevertheless began and the pair almost reached the level of 1.2170. A signal was not formed near this level, since the price did not reach it by 6 points - this is too large an error. The last signal was formed already in the evening, so it should not have been worked out either.
How to trade on Tuesday:
The pair continues to move in a very complex and confusing way on the 30-minute timeframe. The "swing" ended, but the technical picture did not get any better from this. The downward trend has formed, but has already been challenged. And it makes no sense to analyze the movements on Monday, since the US sites were closed. On the 5-minute TF on Tuesday, it is recommended to trade at the levels of 1.1933, 1.1989, 1.2040, 1.2106, 1.2170, 1.2216, 1.2260. When the price passes after opening a deal in the right direction for 20 points, Stop Loss should be set to breakeven. Bank of England Governor Andrew Bailey is scheduled to speak on Tuesday, and we also have the index of business activity in the services sector for June. We do not really count on the PMI index, but Bailey's speech may be interesting. In theory. Unfortunately, Bailey rarely makes loud statements and shares plans for future changes in monetary policy. Therefore, the probability of the market reaction to his speech is low.
Basic rules of the trading system:
1) The signal strength is calculated by the time it took to form the signal (bounce or overcome the level). The less time it took, the stronger the signal.
2) If two or more deals were opened near a certain level based on false signals (which did not trigger Take Profit or the nearest target level), then all subsequent signals from this level should be ignored.
3) In a flat, any pair can form a lot of false signals or not form them at all. But in any case, at the first signs of a flat, it is better to stop trading.
4) Trade deals are opened in the time period between the beginning of the European session and until the middle of the American one, when all deals must be closed manually.
5) On the 30-minute TF, using signals from the MACD indicator, you can trade only if there is good volatility and a trend, which is confirmed by a trend line or a trend channel.
6) If two levels are located too close to each other (from 5 to 15 points), then they should be considered as an area of support or resistance.
On the chart:
Support and Resistance Levels are the Levels that serve as targets when buying or selling the pair. You can place Take Profit near these levels.
Red lines are the channels or trend lines that display the current trend and show in which direction it is better to trade now.
The MACD indicator (14,22,3) consists of a histogram and a signal line. When they cross, this is a signal to enter the market. It is recommended to use this indicator in combination with trend lines (channels and trend lines).
Important speeches and reports (always contained in the news calendar) can greatly influence the movement of a currency pair. Therefore, during their exit, it is recommended to trade as carefully as possible or exit the market in order to avoid a sharp price reversal against the previous movement.
Beginners on Forex should remember that not every single trade has to be profitable. The development of a clear strategy and money management are the key to success in trading over a long period of time.


