


Analysis of Thursday's deals:
30M chart of the EUR/USD pair
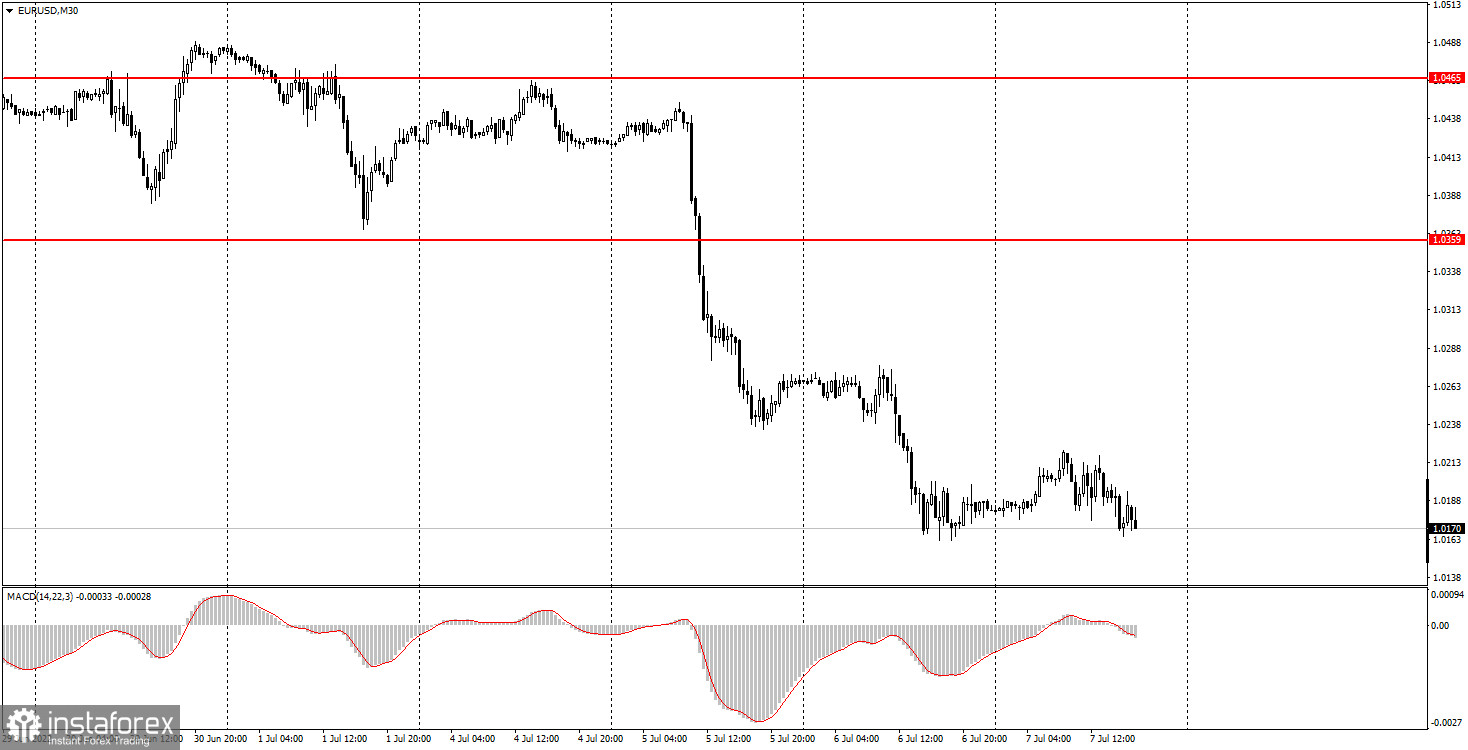
The EUR/USD currency pair tried to start an upward correction on Thursday, but this idea failed very quickly, and a new fall of the euro began in the afternoon. So far, the price has not yet updated its last local low, but it seems that this will not take much time. The ADP report on the change in the number of employees in the private sector could have been singled out among today's macroeconomic statistics if it had not disappeared from all calendars 5 minutes before release. Thus, traders could pay attention only to the report on applications for unemployment benefits, which very rarely provokes a market reaction. In fact, there was nothing to react to today. But even with a virtually empty calendar of macroeconomic events, the technical picture has not changed at all, and the euro has not found the strength to rise in price even a bit. Thus, we continue to expect the pair to fall with a price parity target of 1.0000.
5M chart of the EUR/USD pair
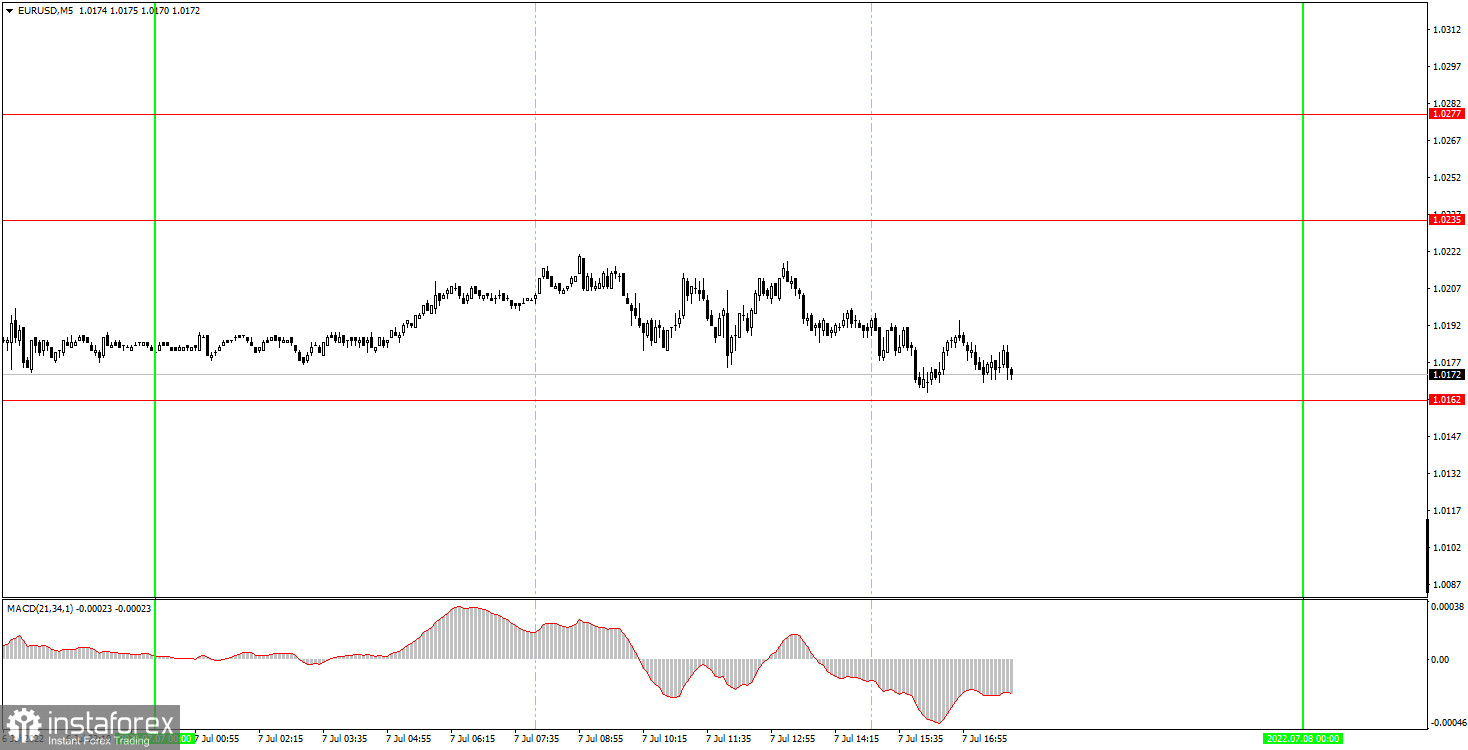
There were no trading signals on the 5-minute timeframe today. We have already said in recent articles that there are very few levels at the current price values, since the price has not been here for 20 years. Traders have only local levels at their disposal, but even today they have not been worked out even once. The pair approached the level of 1.0162 only by the end of the trading day, which is yesterday's low, but even if a trading signal is formed in the near future, it is clearly not worth working on it, because it's too late. Thus, we must wait for tomorrow. If, as we expect (at least until the NonFarm Payrolls report), quotes continue to fall, then the only level around which a signal can be formed is 1.0162. At the same time, we assume that an upward correction will still begin tomorrow, and this can happen even if the Nonfarm report turns out to be strong.
How to trade on Friday:
The new downward trend continues on the 30-minute time frame, but there is still no trend line or channel. Like the levels below. Thus, the euro may well continue to fall on Friday, but there are no reference points on the 30-minute TF now. Thus, you should use the levels from the lower TF, which, by the way, are also very few. On the 5-minute TF on Friday, it is recommended to trade at the levels of 1.0162, 1.0235, 1.0277, 1.0354, 1.0383. When passing 15 points in the right direction, you should set Stop Loss to breakeven. European Central Bank President Christine Lagarde is set to speak in the European Union on Friday, whose rhetoric we have already had the opportunity to study several dozen times. It probably won't change tomorrow. But important reports on unemployment and the labor market will be published in the US. Of course, the most prominent place is occupied by the NonFarm Payrolls report, which is almost always worked out by the market. We would not like to make predictions on how the market might react to it, as the dollar has been rising all week. Therefore, even if the report turns out to be strong, we can see a reverse movement.
Basic rules of the trading system:
1) The signal strength is calculated by the time it took to form the signal (bounce or overcome the level). The less time it took, the stronger the signal.
2) If two or more deals were opened near a certain level based on false signals (which did not trigger Take Profit or the nearest target level), then all subsequent signals from this level should be ignored.
3) In a flat, any pair can form a lot of false signals or not form them at all. But in any case, at the first signs of a flat, it is better to stop trading.
4) Trade deals are opened in the time period between the beginning of the European session and until the middle of the US one, when all deals must be closed manually.
5) On the 30-minute TF, using signals from the MACD indicator, you can trade only if there is good volatility and a trend, which is confirmed by a trend line or a trend channel.
6) If two levels are located too close to each other (from 5 to 15 points), then they should be considered as an area of support or resistance.
On the chart:
Support and Resistance Levels are the Levels that serve as targets when buying or selling the pair. You can place Take Profit near these levels.
Red lines are the channels or trend lines that display the current trend and show in which direction it is better to trade now.
The MACD indicator (14,22,3) consists of a histogram and a signal line. When they cross, this is a signal to enter the market. It is recommended to use this indicator in combination with trend lines (channels and trend lines).
Important speeches and reports (always contained in the news calendar) can greatly influence the movement of a currency pair. Therefore, during their exit, it is recommended to trade as carefully as possible or exit the market in order to avoid a sharp price reversal against the previous movement.
Beginners on Forex should remember that not every single trade has to be profitable. The development of a clear strategy and money management are the key to success in trading over a long period of time.


