


Analysis of Thursday's deals:
30M chart of the GBP/USD pair
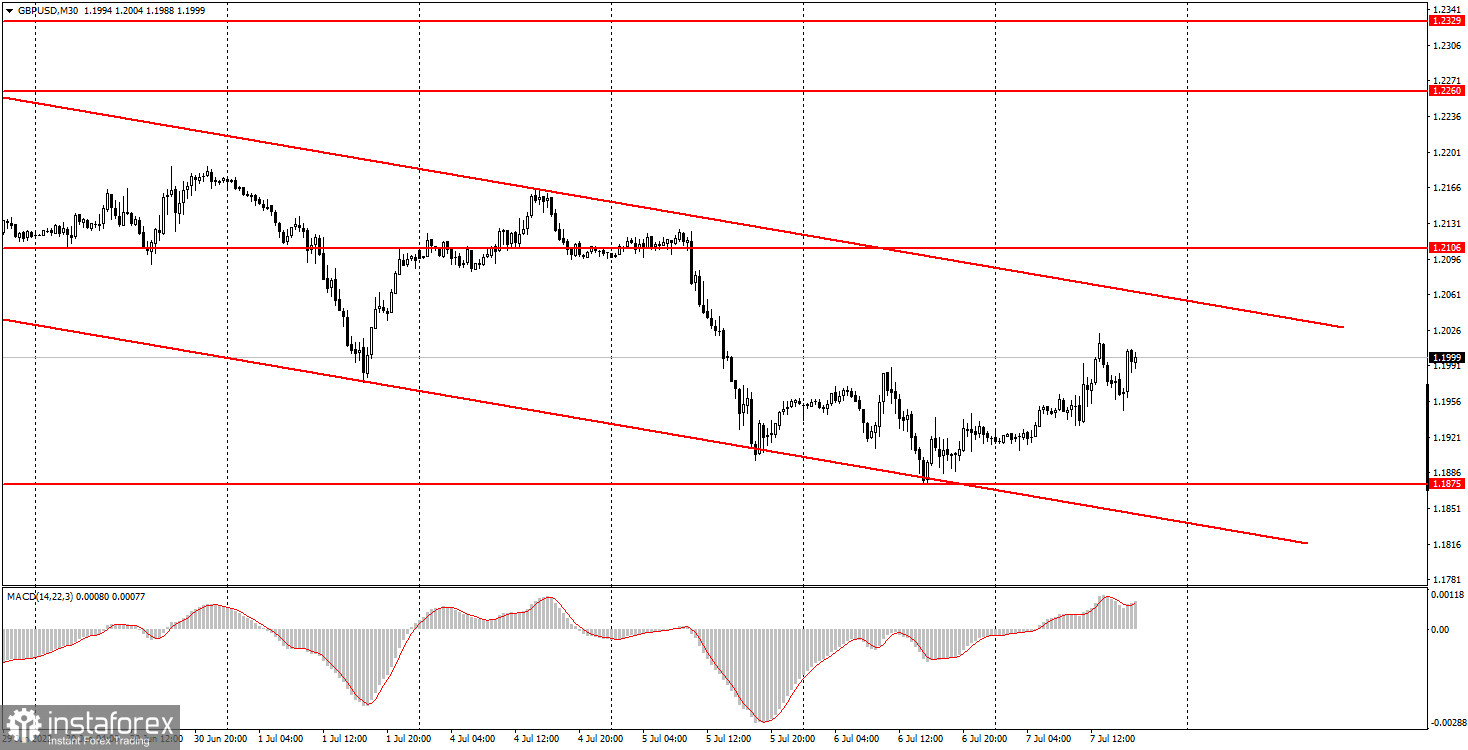
The GBP/USD pair began to correct on Thursday, which is very strange, since in recent months the euro and the pound have been trading almost identically. However, today the market found grounds for a slight increase in the British currency, which is even more strange, since there was no positive news from the UK. There were no macroeconomic statistics at all, US data were absolutely secondary, and the only news of the day was the resignation of British Prime Minister Boris Johnson after another scandal with his participation. Johnson will remain at the helm of the country for a while until the Conservative Party chooses a new leader. However, now we can say with certainty that Johnson is leaving his post. It is difficult to say whether this is good or bad for the British currency. However, with the pound up today when the euro was down, we can assume that the market is happy about Johnson's exit. In any case, the pound has not risen in price enough to talk about the end of the downward trend. The descending channel remains relevant and until the price settles above it, it makes no sense to count on a strong growth from the pound.
5M chart of the GBP/USD pair
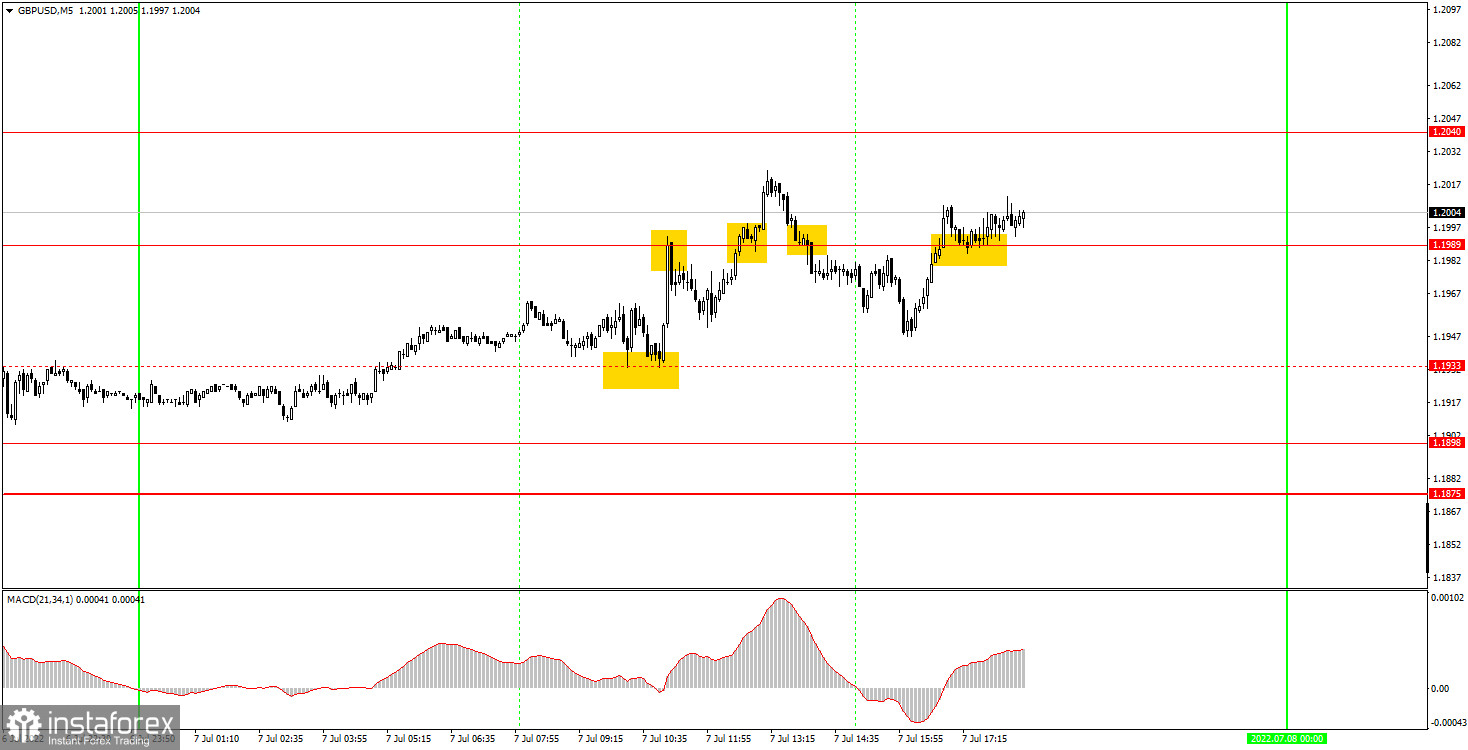
Today's movement on the 5-minute timeframe was not the best. The pair was correcting, but at the same time it often rolled back down. Four out of five trading signals were formed around the same 1.1989 level. These four turned out to be false, since the price never reached the nearest target level. Therefore, it was absolutely necessary to trade only the first two signals. However, before the formation of these signals, the pair still managed to form a strong signal near the level of 1.1933, which was removed from the chart by the end of the day. A long position opened on this signal brought about 20 points of profit. The first sell signal near the 1.1989 level triggered a fall by 20 points. It is very fortunate that the price went down 20 points before returning to the level of 1.1989 and settled above it. Novice traders at least managed to set Stop Loss to breakeven. The next buy signal was, unfortunately, unprofitable, as this time the price failed to move 20 points in the right direction. And the last two signals should not have been worked out. Today ended up being a bad day, but it's still impossible for every day to be profitable. We recall that traders could get a good profit yesterday.
How to trade on Friday:
The pair continues to be in a downward trend on the 30-minute timeframe, but now beginners have a downward channel. As we have already said, we are waiting for a correction in the last two trading days of the week only on the basis of technical factors. Today the correction started, it is possible to continue tomorrow. On the 5-minute TF on Friday it is recommended to trade at the levels of 1.1875-1.1898, 1.1989, 1.2040, 1.2106. When the price passes after opening a deal in the right direction for 20 points, Stop Loss should be set to breakeven. There are no interesting events planned for the UK. On the other hand, there are two reports in America, one of which deserves more attention - the NonFarm Payrolls report on the number of new jobs created outside the agricultural sector. The reaction to it can be completely unpredictable and illogical.
Basic rules of the trading system:
1) The signal strength is calculated by the time it took to form the signal (bounce or overcome the level). The less time it took, the stronger the signal.
2) If two or more deals were opened near a certain level based on false signals (which did not trigger Take Profit or the nearest target level), then all subsequent signals from this level should be ignored.
3) In a flat, any pair can form a lot of false signals or not form them at all. But in any case, at the first signs of a flat, it is better to stop trading.
4) Trade deals are opened in the time period between the beginning of the European session and until the middle of the US one, when all deals must be closed manually.
5) On the 30-minute TF, using signals from the MACD indicator, you can trade only if there is good volatility and a trend, which is confirmed by a trend line or a trend channel.
6) If two levels are located too close to each other (from 5 to 15 points), then they should be considered as an area of support or resistance.
On the chart:
Support and Resistance Levels are the Levels that serve as targets when buying or selling the pair. You can place Take Profit near these levels.
Red lines are the channels or trend lines that display the current trend and show in which direction it is better to trade now.
The MACD indicator (14,22,3) consists of a histogram and a signal line. When they cross, this is a signal to enter the market. It is recommended to use this indicator in combination with trend lines (channels and trend lines).
Important speeches and reports (always contained in the news calendar) can greatly influence the movement of a currency pair. Therefore, during their exit, it is recommended to trade as carefully as possible or exit the market in order to avoid a sharp price reversal against the previous movement.
Beginners on Forex should remember that not every single trade has to be profitable. The development of a clear strategy and money management are the key to success in trading over a long period of time.


