


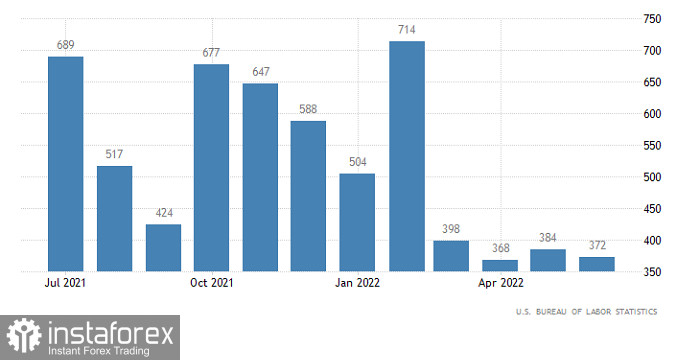
You can clearly see the fact that the dollar is overbought. The market still needs at least a local correction. And apparently, it was this fact that became the reason for the upward movement that began in the middle of Friday. The pound continued to rise even after the release of the report of the United States Department of Labor, the content of which turned out to be much better than forecasts. Even despite the revision of previous data on the number of new jobs created outside of agriculture. They were reduced from 390,000 to 384,000. It was expected that 300,000 new jobs would be created in June, but there were as many as 372,000. So the US labor market continues to grow steadily, despite a record low unemployment rate. And logically, this should have led to the strengthening of the dollar, but the strong overbought of the US currency did its job.
Number of New Non-Agricultural Jobs (United States):
Despite the completely empty macroeconomic calendar, the new trading week began with a gradual strengthening of the US currency. The movement is purely symbolic, but its direction does not ambiguously indicate the mood of market participants - further strengthening of the dollar.
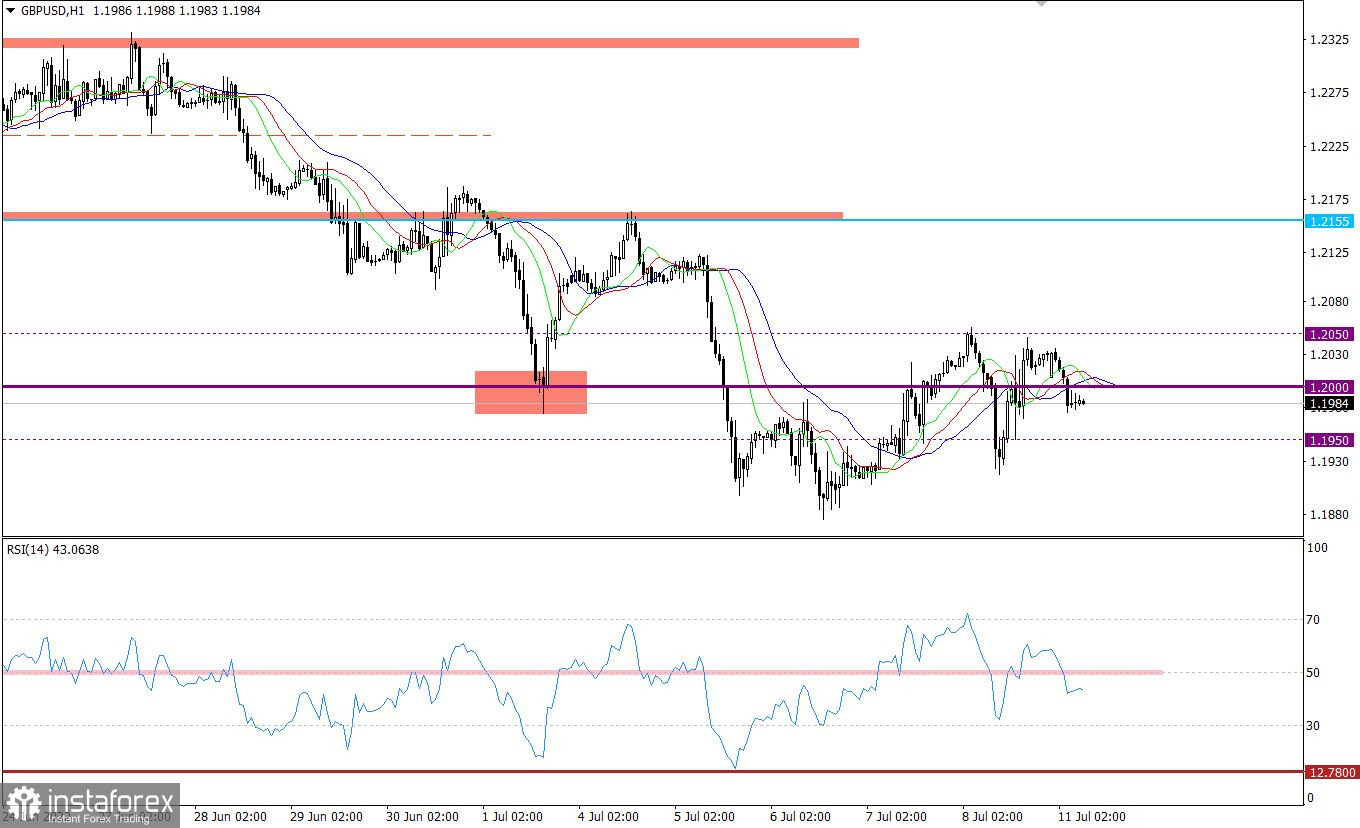
The GBPUSD currency pair, despite many attempts to resume the downward cycle, still has a bump along the area of the psychological level of 1.2000 (1.1950/1.2000/1.2050). In fact, this indicates an overheating of short positions, which are trying to regroup the trading forces in the stage of a change of turbulence.
The technical tool RSI H1 and H4 is moving along the 50 middle line, which corresponds to the bumpy variable. RSI D1 is moving in the lower area of the 30/50 indicator, which indicates a downward trend.
The MA moving lines on the Alligator H4 indicator are intertwined, which confirms the stagnation stage. The MA lines on Alligator D1 are directed downwards, which corresponds to a downward trend.
Expectations and prospects
In this situation, traders are focused on the deviation levels of 1.1950 and 1.2050, since a stable price hold beyond one or another value, at least in a four-hour period, can indicate the subsequent price path.
The complex indicator analysis has a variable signal in the short-term and intraday periods due to the turbulence. In the medium term, technical instruments are guided by a global downtrend.


