


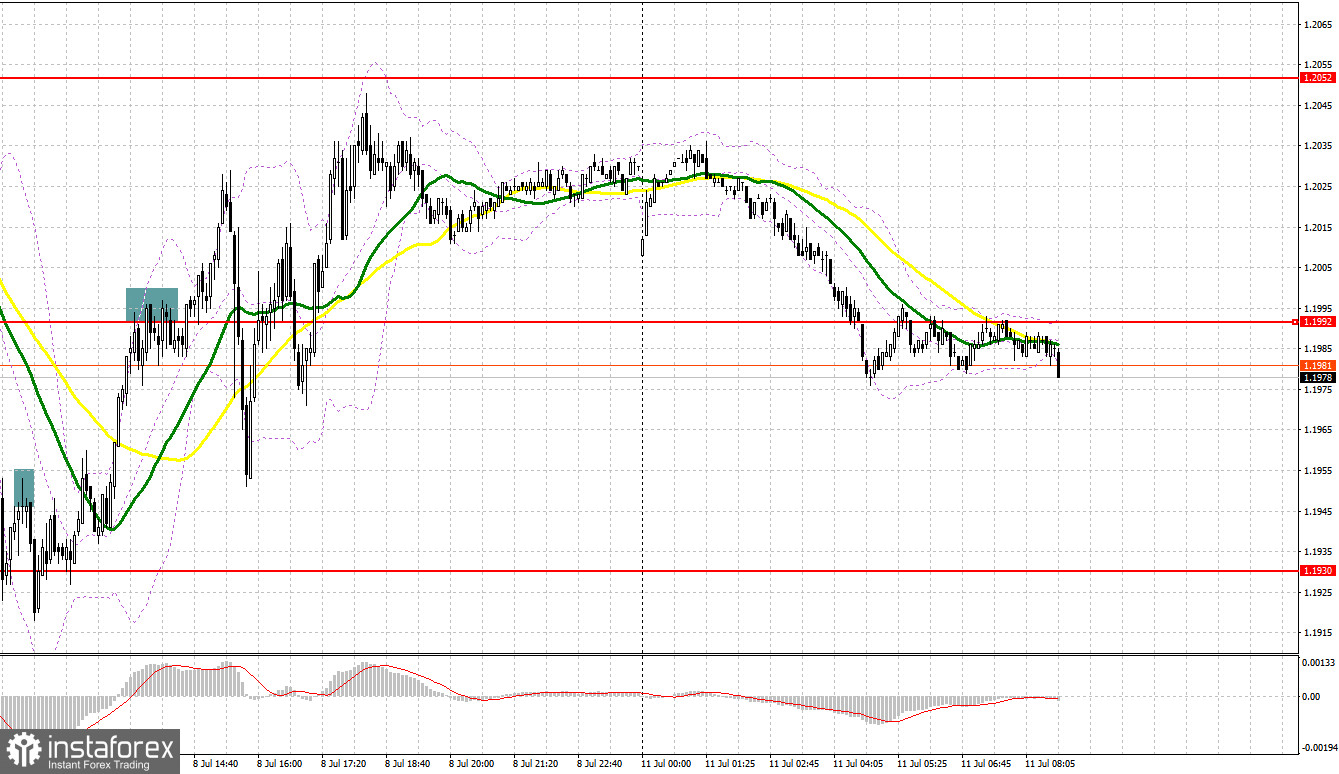
Several market entry signals were formed on Friday. Let's take a look at the 5-minute chart and see what happened. I paid attention to the 1.1949 level in my morning forecast and advised making decisions from it. A breakthrough and test of this range from the bottom up all led to a great point for short positions in continuation of the bear market. Considering that this was the second wave of the pound's decline, the downward movement amounted to about 30 points, after which the pressure on the pair eased. After rising to the 1.1992 area in the afternoon, the bears tried to protect this level and even created an excellent entry point for short positions before the release of statistics on the US labor market, but the pair did not come down to a major fall.
When to go long on GBP/USD:
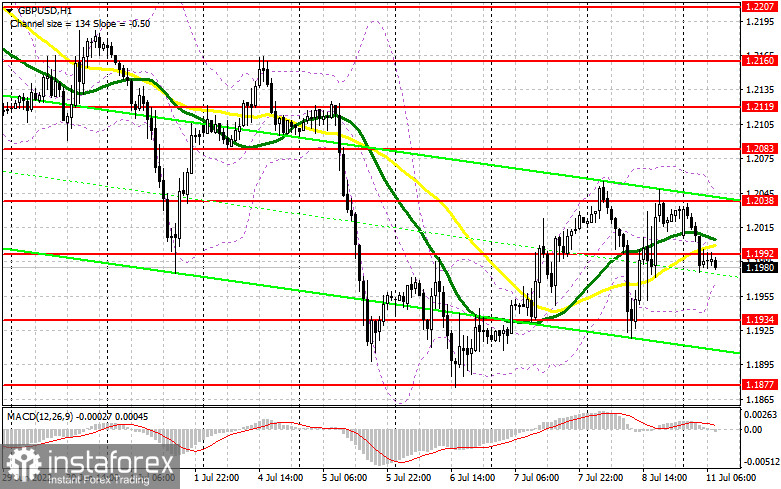
A strong labor market in the United States, on the one hand, solves a number of problems, and on the other hand, creates them. Friday's new jobs report didn't help the dollar much, even though the numbers beat analysts' forecasts. However, this does not negate the fact that the bear market for the pound is still present. Today there will be only a speech by Bank of England Governor Andrew Bailey, who is unlikely to change his approach to monetary policy. Therefore, I do not expect any special changes in the market - most likely the pressure on the pair will increase. In case GBP/USD declines, forming a false breakout at 1.1934 will be an excellent signal to open long positions in order to move up to the nearest resistance area of 1.1992, on which quite a lot depends. Moving averages pass at the level of 1.1992, which will be another chance for bulls to build a larger upward correction. A breakthrough and test from top to bottom at 1.1992 will provide a buy signal as we count on a sharper jump up and updating 1.2038. A similar breakthrough of this level after Bailey's speech will lead to another entry point into long positions with the prospect of exiting at 1.2083, where I recommend taking profits. A more distant target will be the area of 1.2119, which will be a clear application for building a new upward trend.
If GBP/USD falls and there are no bulls at 1.1934, this will increase pressure on the pair. In this case, I recommend holding back on long positions to 1.1877, but I advise you to buy there only on a false breakout. You can open long positions on GBP/USD immediately for a rebound from 1.1816, or even lower - around 1.1742 with the goal of correcting 30-35 points within the day.
When to go short on GBP/USD:
The bears tried to take control of the market on Friday, but the bulls bought the fall very quickly. Today, the main task is to protect the important resistance at 1.1992, formed on the basis of last Friday. But in order to regain control of the market, bears need to break the price below 1.1934 as quickly as possible, which will not be easy to do.
In case GBP/USD grows in the first half of the day after Bailey's speech, forming a false breakout at the level of 1.1992, where the moving averages pass, will provide the first entry point into short positions in continuation of the bearish scenario and with the prospect of a return to 1.1934. Consolidation below 1.1934 and a reverse test from the bottom up will greatly affect the bulls' stop orders, which create another entry point for short positions on the pound with a decrease to 1.1877, where I recommend partially taking profits. A more distant target will be the area of 1.1816, the test of which will be evidence of the resumption of the downward trend.
In case GBP/USD grows and the bears are not active at 1.1992, the situation will change in the bulls' direction. In this case, I advise you not to rush into long positions. Only a false breakout in the area of the next resistance at 1.2038 will provide an entry point to short positions, counting on the pair's rebound downwards. In case traders are not active at 1.2038, another upsurge may occur amid the removal of stop orders of speculative sellers. In this case, I advise you to postpone short positions to 1.2083, where you can sell GBP/USD immediately for a rebound, based on a rebound of the pair down by 30-35 points within the day.
COT report:
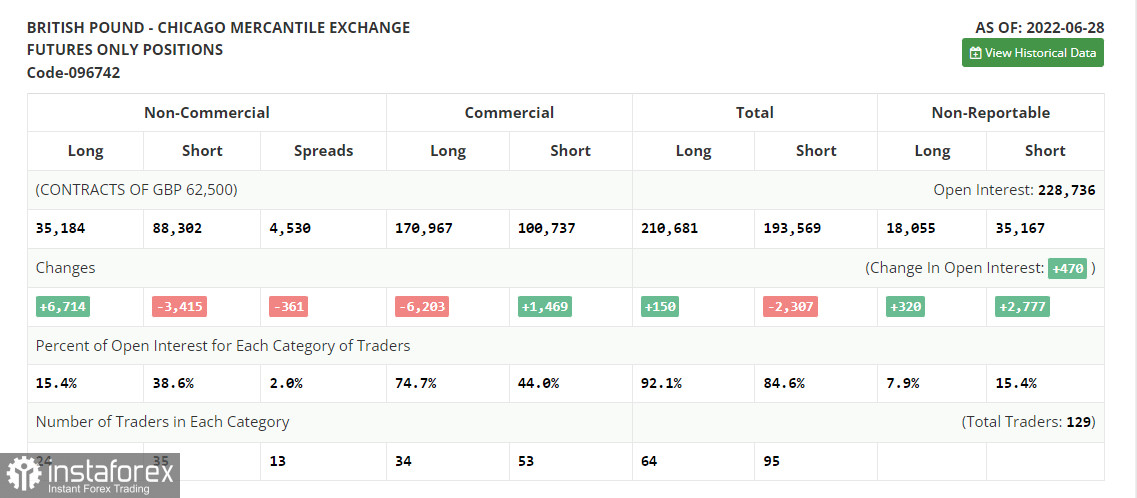
The Commitment of Traders (COT) report for June 28 logged a decline in short positions and a sharp increase in long positions, which indicates an attempt to buy another annual low after the Bank of England's decision to raise interest rates and remain committed to an aggressive monetary policy. The sharp inflationary surge in May of this year does not leave the central bank a chance for a softer tightening cycle. The ongoing cost of living crisis in the UK is making the economy more vulnerable, especially as rates are forced to rise to fight high inflationary pressures. All this does not add to the pound's appeal, which is steadily moving down to the lows of 2020. The policy of the Federal Reserve and its pace of interest rate hikes is giving the dollar much more support. The COT report indicated that long non-commercial positions rose 6,714 to 35,184, while short non-commercial positions decreased 3,415 to 88,302, however this did not greatly affect the overall picture of the bear market, and led only to a small decrease in the negative value of the non-commercial net position from the level of -63,247 to the level of -53,118. The weekly closing price decreased and amounted to 1.2201 against 1.2295.
I recommend to read:
Indicator signals:
Moving averages
Trading is below the 30 and 50-day moving averages, indicating the bears' attempt to regain control.
Note: The period and prices of moving averages are considered by the author on the H1 hourly chart and differs from the general definition of the classic daily moving averages on the daily D1 chart.
Bollinger Bands
In case of growth, the area of 1.2038 will act as resistance. If the pair goes down, the lower border of the indicator around 1.1970 will act as support.
Description of indicators
- Moving average (moving average, determines the current trend by smoothing out volatility and noise). Period 50. It is marked in yellow on the chart.
- Moving average (moving average, determines the current trend by smoothing out volatility and noise). Period 30. It is marked in green on the chart.
- MACD indicator (Moving Average Convergence/Divergence — convergence/divergence of moving averages) Quick EMA period 12. Slow EMA period to 26. SMA period 9
- Bollinger Bands (Bollinger Bands). Period 20
- Non-commercial speculative traders, such as individual traders, hedge funds, and large institutions that use the futures market for speculative purposes and meet certain requirements.
- Long non-commercial positions represent the total long open position of non-commercial traders.
- Short non-commercial positions represent the total short open position of non-commercial traders.
- Total non-commercial net position is the difference between short and long positions of non-commercial traders.


