


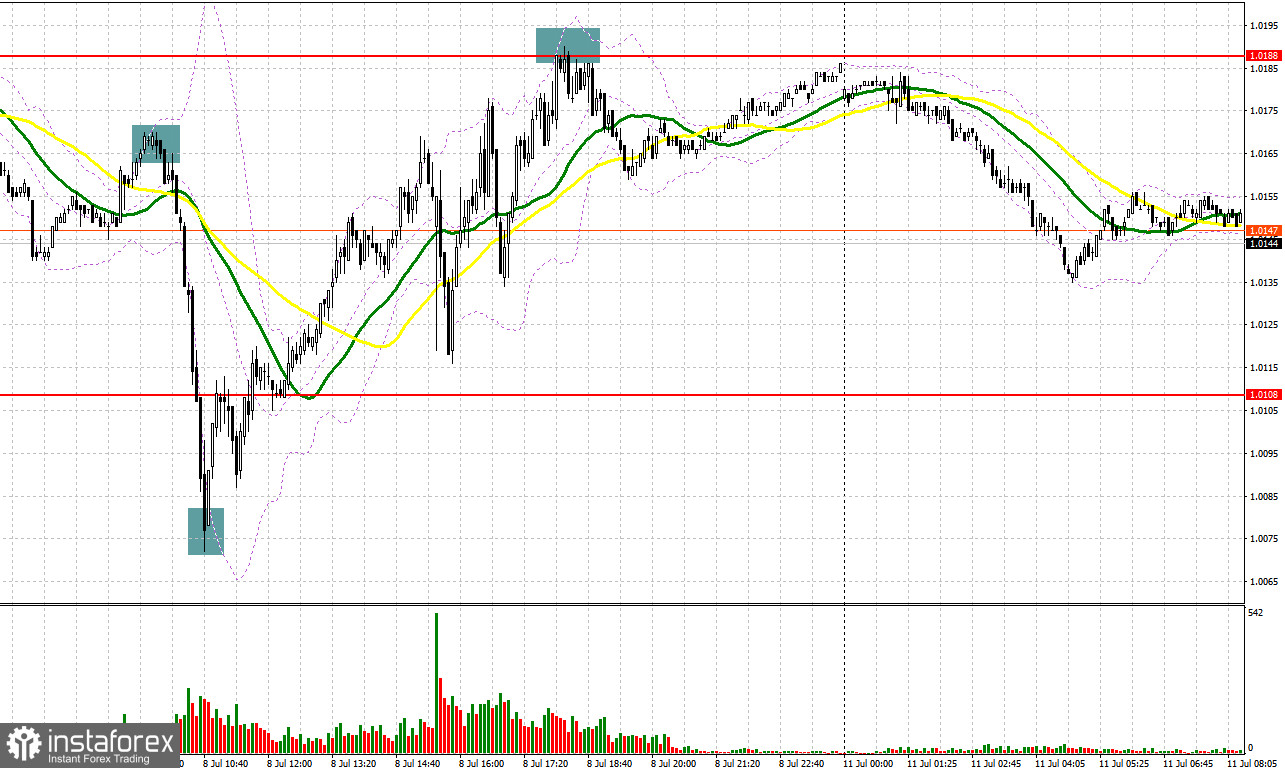
Several interesting market entry signals were formed on Friday. Let's take a look at the 5-minute chart and see what happened. I paid attention to the levels 1.0165 and 1.0072 in my morning forecast and advised you to make decisions on entering the market. A small rise and false breakout around 1.0165 at the beginning of the European session led to an excellent signal to sell the euro, which resulted in a large fall by 90 points. Only in the area of 1.0072, where I also advised buying the euro, could one get another entry point into the market, which caused the pair to rebound upwards by more than 60 points. After rising to 1.0188 in the afternoon, forming a false breakout created an excellent entry point for selling the euro, which gave about 25 points of profit.
When to go long on EUR/USD:
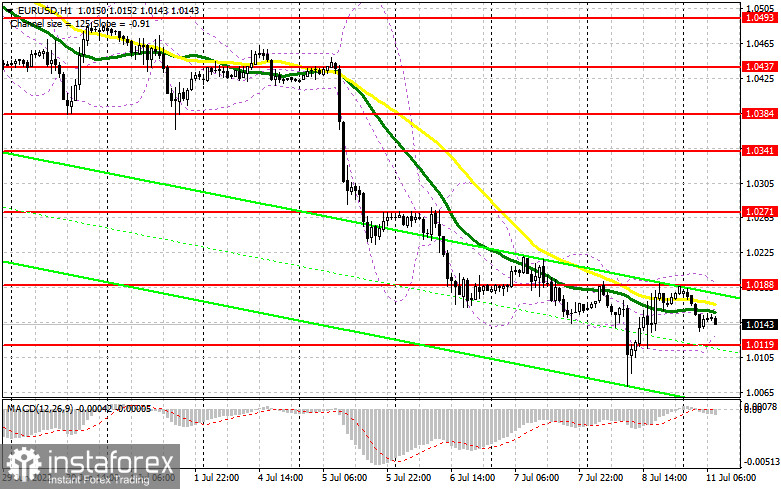
Data on the US labor market, which showed that the number of new jobs amounted to almost 400,000 in June, point to the strength of the economy. The active increase in interest rates in the US so far has no effect on the population and employers, which allows us to make more optimistic forecasts, as well as expect that the recession will be rather mild and will not affect the main sectors of the economy as much. Today there is nothing that could significantly affect the direction of the EUR/USD pair and help the euro, so I expect trading mainly in the horizontal channel. If the pair falls after the Eurogroup meeting, the best scenario for opening long positions will be forming a false breakout in the area of the nearest support at 1.0119, which creates a signal to enter the market in the hopes of trying to build at least some upward correction at the beginning of the week with the prospect of updating 1.0188. Moving averages are slightly below this level, playing on the bears' side. A breakthrough and test of 1.0188 would hit bearish stops, opening 1.0271. However, there is no need to talk about a bear market turning point yet. A breakthrough of 1.0271 will lead to an update of 1.0341, where I recommend taking profits.
If the EUR/USD declines and there are no bulls at 1.0119, and everything indicates that the pair will update it in the near future, I advise you not to rush to enter the market. The best option for opening long positions would be a false breakout in the support area of 1.0052. I advise you to buy EUR/USD immediately on a rebound only from the low in the 1.0000 area, or even lower - in the 0.9958 area, counting on an upward correction of 30-35 points within the day.
When to go short on EUR/USD:
The bears are still coping with all the tasks and are in control of the market. The best option for selling the euro would be forming a false breakout in the area of 1.0188, above which it has not been possible to get out since the end of last week. Protecting this level will be another proof of the presence of large players in the market, betting on a further fall in risky assets. This also creates a signal to open short positions with the prospect of updating the low of 1.0119. A breakdown and consolidation below this range, as well as a reverse test from the bottom up - all this will lead to another sell signal with the removal of bulls' stops and a larger movement of the pair down to the 1.0052 area and a good option for updating 1.0000, where I recommend completely exiting shorts. A more distant target will be the area of 0.0058. In case EUR/USD moves up during the European session, as well as the absence of bears at 1.0188, the upward correction may increase significantly, however, it will hardly be possible to expect a more rapid upswing of the pair amid the absence of important statistics and low trading volume.
With growth above 1.0188, I advise you to postpone short positions to a more attractive level of 1.0271. Forming a false breakout there will be a new starting point for a downward correction of the pair. You can sell EUR/USD immediately on a rebound from the high of 1.0341 counting on a downward correction of 30-35 points.
COT report:
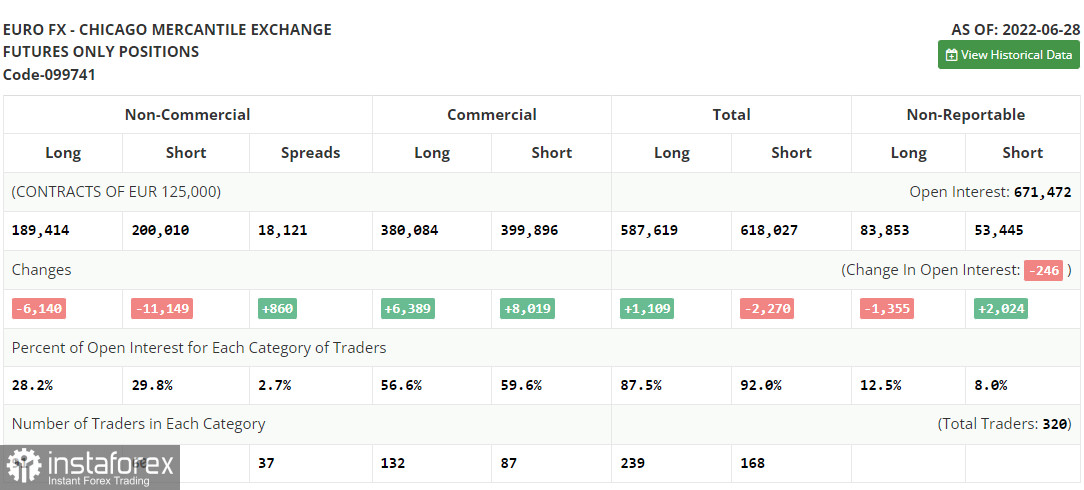
The Commitment of Traders (COT) report for June 28 again logged a reduction in both long and short positions, but this did not lead to forming a larger negative delta, since there were much fewer short positions than long ones. European Central Bank President Christine Lagarde spoke last week, as did Federal Reserve Chairman Jerome Powell. They all spoke of the need to further raise interest rates in order to combat the highest inflation in recent memory. Let me remind you that this month the ECB intends to start raising interest rates, which should limit the dollar's upward potential against the euro. The data on inflation in the euro area, released last week, became another proof that it is no longer possible to delay. However, given the current situation in the global economy, there is now more demand for safe haven assets. We are waiting for parity in the EUR/USD pair. The COT report indicated that long non-commercial positions decreased by 6,140 to 189,414, while short non-commercial positions decreased by 11,149 to 200,010. In many developed countries - all this continues to push for long positions on the dollar. At the end of the week, the total non-commercial net position remained negative and amounted to -10,596 against -15,605. The weekly closing price dropped and amounted to 1.0584 against 1.0598.
Indicator signals:
Moving averages
Trading is below the 30 and 50-day moving averages, which indicates further decline in the pair.
Note: The period and prices of moving averages are considered by the author on the H1 hourly chart and differs from the general definition of the classic daily moving averages on the daily D1 chart.
Bollinger Bands
In case of a decrease, the lower border of the indicator around 1.0119 will act as support. In case of growth, the upper border of the indicator in the area of 1.0188 will act as resistance.
Description of indicators
- Moving average (moving average, determines the current trend by smoothing out volatility and noise). Period 50. It is marked in yellow on the chart.
- Moving average (moving average, determines the current trend by smoothing out volatility and noise). Period 30. It is marked in green on the chart.
- MACD indicator (Moving Average Convergence/Divergence — convergence/divergence of moving averages) Quick EMA period 12. Slow EMA period to 26. SMA period 9
- Bollinger Bands (Bollinger Bands). Period 20
- Non-commercial speculative traders, such as individual traders, hedge funds, and large institutions that use the futures market for speculative purposes and meet certain requirements.
- Long non-commercial positions represent the total long open position of non-commercial traders.
- Short non-commercial positions represent the total short open position of non-commercial traders.
- Total non-commercial net position is the difference between short and long positions of non-commercial traders.


