


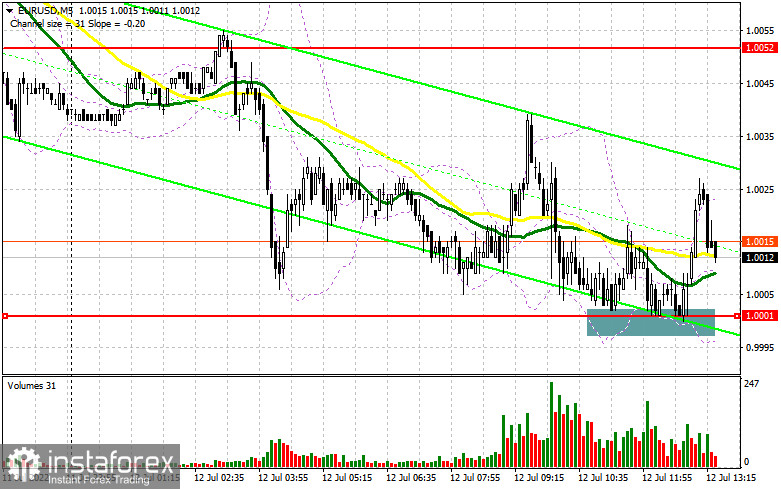
In my forecast this morning, I drew your attention to the level of 1.0001 and recommended entering the market from it. Let's have a look at the 5-minute chart and analyze what happened there. It did not take long for the pair to decline, especially after the sharp decline in the ZEW Economic Sentiment and ZEW Survey (Current Situation) indices. The false breakout at 1.0001 gave a buy signal, but after the upside movement of 25 pips, big players provided no support. As a result, the euro declined and came close to parity against the US dollar again. Most likely, in the second half of the day, we may witness a breakthrough of a psychologically important level of 1.0000.
Long positions on EUR/USD:
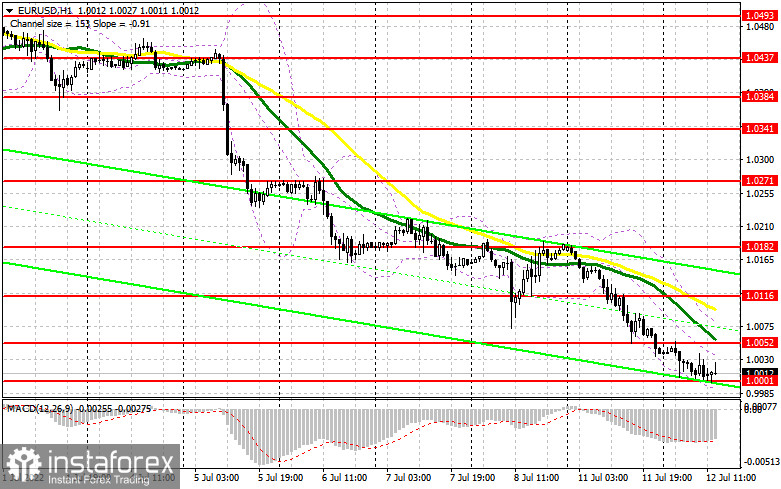
Considering that the technical picture did not change compared to the European session and there are no important fundamental statistics in the second half of the day, it is likely that the bears may make another attempt to pierce 1.0001. All we can pay attention to is the NFIB Small Business Optimism Index and the Redbook index, which is a proprietary indicator of growth in retail sales. Strong numbers may push the EUR/USD pair down and the level of 1.0001 may be tested. Only after the false breakout at this level, we can expect an upward correction, similar to the one we saw in the morning. In this case, the target will be located at the resistance of 1.0052, which bulls failed to reach yesterday during the US session. A breakthrough and a top/bottom test of this level may trigger sellers' Stop-Loss orders, giving a signal to open long positions counting on a larger rally to 1.0116, where the moving averages are on the sellers' side. Once the price reached this level, bears would try to build the upper boundary of the descending channel. The next target would be located at 1.0182, where I recommend locking in profits. In the second half of the day, if the EUR/USD pair declines and bulls show weak activity at 1.0001, which is more likely, the pressure on the euro is likely to seriously increase again. In this case, I would not recommend entering the market. It is better to open long positions after a false breakout near 0.9958. I also recommend buying the euro on a pullback only from 0.9915, or even lower near 0.9886, allowing an upward intraday correction of 30-35 pips.
Short positions on EUR/USD:
There are so few buyers in the market that they failed to push the euro to the area of 1.0052. As long as the trading is carried out below this level, I would expect a further decline in the pair. A rebound of the euro to the upside may take place only if the upcoming US data turns out to be weak but it is unlikely to happen. However, if that happens, only the formation of a false breakout near the resistance of 1.0052 may give a signal for opening short positions, counting on a decline and return to the support of 1.0001, which is an inch away from parity. A breakthrough and a fixation below that level, as well as a reverse bottom/top test, similar to what I mentioned in the morning, may give an additional sell signal, triggering buyers' Stop-Loss orders and a movement of the pair down to the area of 0.9958. A breakthrough and a consolidation below this level may open the road to 0.9915, where traders may close their short positions and take profits. The next target is located in the area of 0.9886. If the EUR/USD pair increases during the US session and bears show a lack of activity at 1.0052, it is better to postpone opening short positions until the pair reaches resistance of 1.0116, where the moving averages pass. A downward rebound from this level is likely to happen even if traders close their long positions. A false breakout at 1.0116 could be a new starting point for the bear market. You may sell the euro on a rebound from a high of 1.0182, or even higher near 1.0271, counting on a downward correction of 30-35 pips.
The COT report for July 5 logged an increase in both long and short positions but the latter were almost twice as many, indicating a continued bearish sentiment in the market. This led to an increase in the negative delta. Last week, the eurozone retail sales were disappointing, while the US labor market data, on the contrary, pointed to the Fed that it needed to keep its aggressive monetary policy, fighting the high inflation rate. European Central Bank President Christine Lagarde also flagged the need to start raising interest rates for the same purpose. An important US inflation report is expected soon, which could again point to another spike in prices. If that happens, the US dollar may rise against the euro and reach parity. The COT report showed that long non-commercials rose by 7,724 to 197,138, while short non-commercials increased by 13,980 to 213,990. Despite the low euro, the need for further aggressive central bank policy, and the recession in many developed countries, all these factors continue to push traders to buy the US dollar. At the end of the week, the total non-commercial net position remained negative at -16,852 against -10,596. The weekly closing price fell to 1.0316 against 1.0584.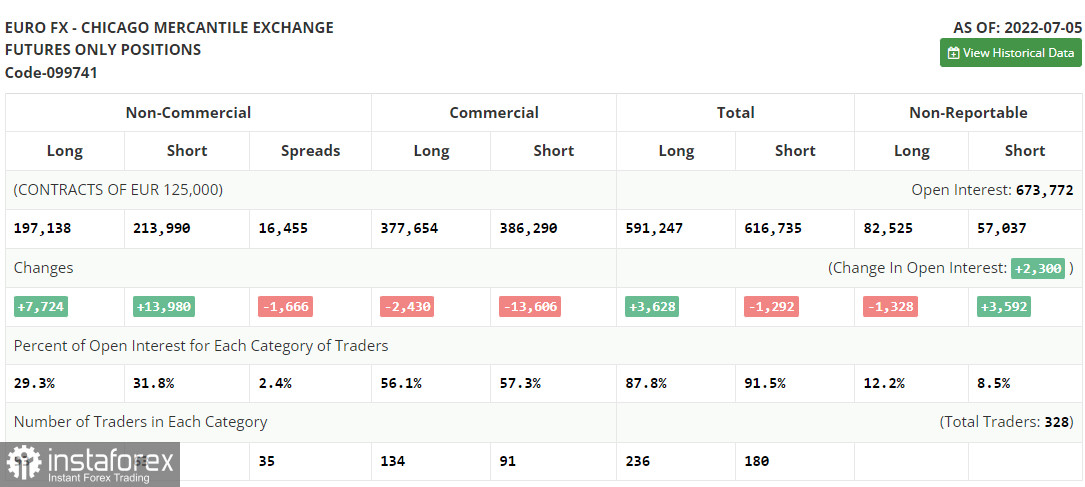
- Moving average defines the current trend by smoothing out volatility and market noise. Period 50. Marked in yellow on the chart.
- Moving average defines the current trend by smoothing out volatility and market noise. Period 30. Marked in green on the chart.
- MACD (Moving Average Convergence/Divergence) indicator Fast EMA of period 12. Slow EMA period 26. SMA period 9.
- Bollinger Bands. Period 20.
- Non-commercial traders are speculators, such as individual traders, hedge funds, and large institutions, which use the futures market for speculative purposes and meet certain requirements.
- Long non-commercial positions represent the total long open position of non-commercial traders.
- Short non-commercial positions represent the total short open position of non-commercial traders.
- Total non-commercial net position is the difference between short and long positions of non-commercial traders.


