


Gold (#GOLD):
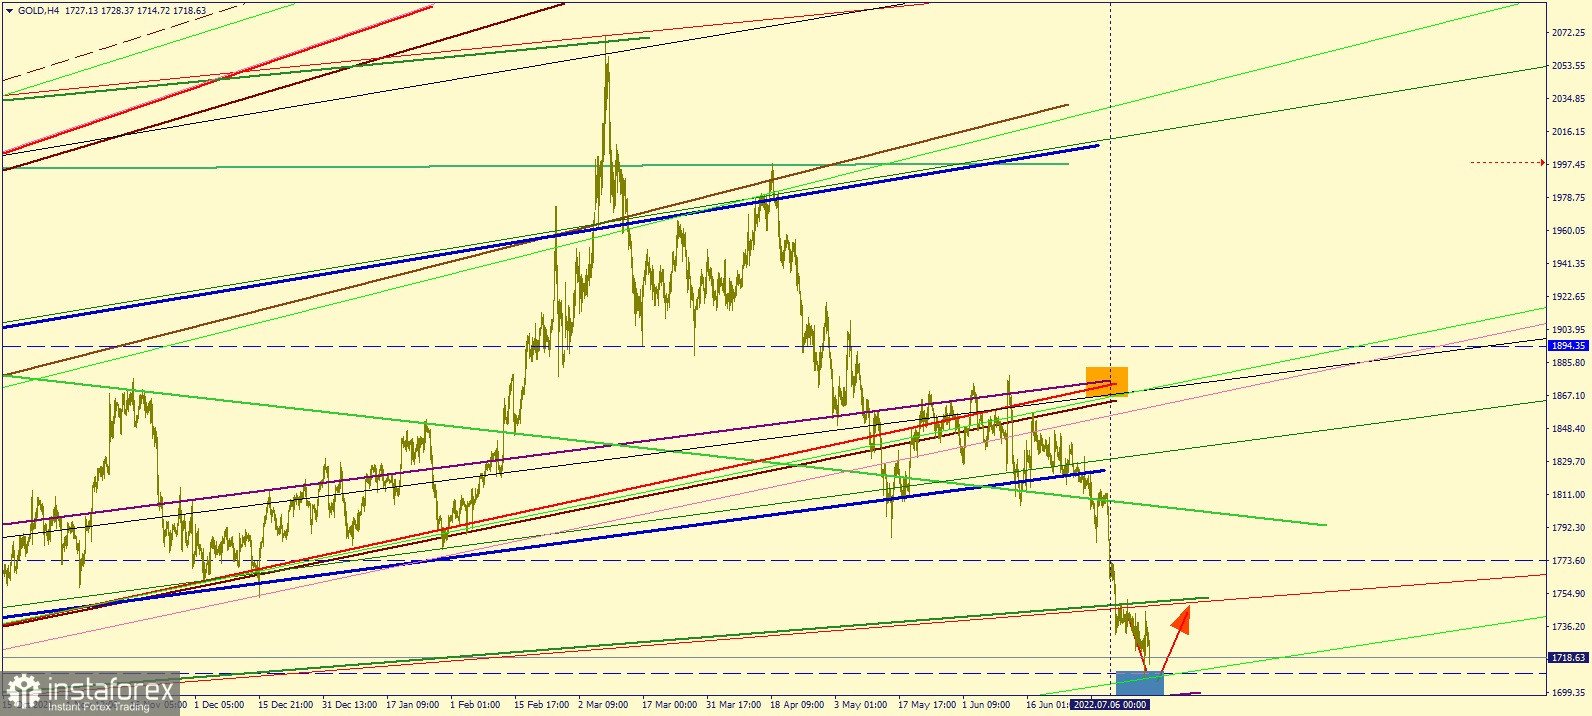
The chart shows the current movement of gold in the 4-hour (H4) chart.
Yesterday, July 14, gold tested a new support level located at $1705.0. It then rose to the resistance level of $1754.0 (represented by the green sloping line), before returning to the support level.
The metal may linger around the area of the support and resistance levels.
A breakdown of $1747.0 -1750.0 may lead to a test of $1773.0, while the breakdown of the support level will result to a test of the lower level at $1670.0.
Platinum (#PLF):
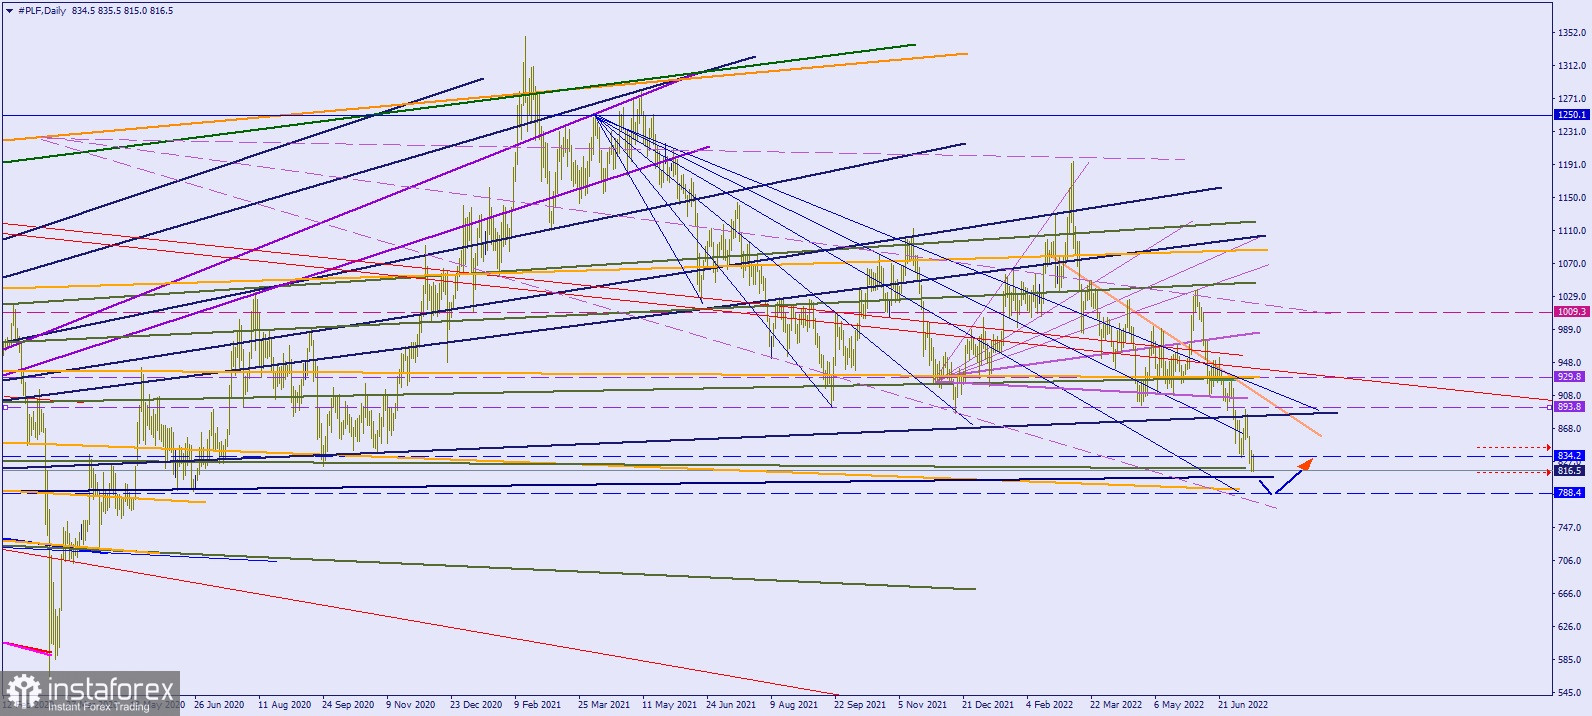
The chart shows the current movement of platinum in the daily (D1) chart.
The metal continues to decline to $788.0, which can be considered as a key support level and a possible trend reversal.
A breakdown of this level will continue the trend to $747.0.
As far as we know, the cost of producing platinum from different producers is around $830.0. In this case, sellers will stop until the spot market for secondary platinum becomes scarce.


