


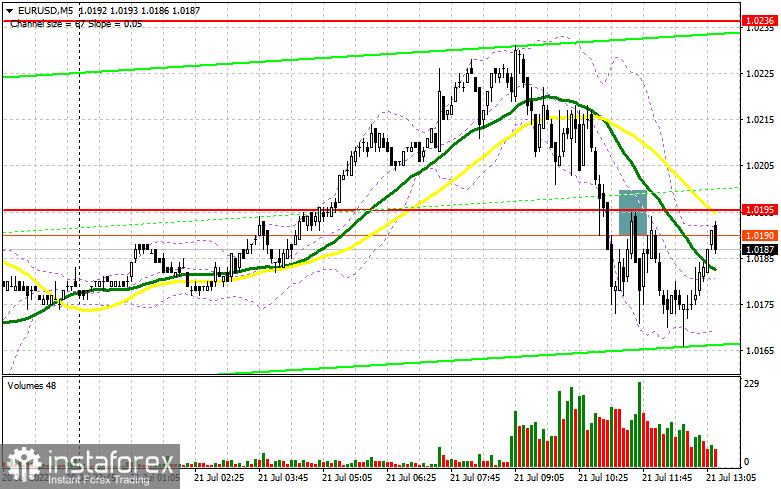
In the morning article, I highlighted the level of 1.0195 and recommended making decisions with this level in focus. Now, let's look at the 5-minute chart and try to figure out what actually happened. A breakout and an upward test of this level gave an excellent sell signal. The euro/dollar pair dropped by 20 pips. However, the pair did not decline further as I expected. Apparently, traders decided not to take risks and wait for the ECB's key rate decision. In the afternoon, the technical outlook has changed significantly as well as the strategy.
What is needed to open long positions on EUR/USD
Now, analysts are trying to guess whether the ECB will decide to tighten monetary policy more aggressively or will stick to its initial plan. Households, companies, and the government are extremely concerned about soaring inflation. There are rumors that ECB policymakers may even consider a 0.5% rate increase instead of a 0.25 basis point one at today's meeting. If this scenario comes true, the pair may rise to monthly highs. If EUR/USD declines and a quite predictable 0.25% rate hike takes place, the euro is unlikely to face bearish pressure. It is recommended to focus attention on the speech of ECB President Christine Lagarde, scheduled for the afternoon. To cement the upward movement, the bulls need to defend the intraday low of 1.0171. Only after a false breakout of this level, the pair may start a steady rally, breaking through the nearest resistance level of 1.0227. A further trajectory of the price will largely depend on this level. EUR bears will not miss the chance to struggle for this level. Only a breakout and a downward test of this level will trigger a drop in the sellers' stop-loss orders. If so, a buy signal will appear with the prospect of a rise to the upper border of the new sideways channel of 1.0271. Intraday traders are likely to start leaving the market at this level, which will limit the upward potential of the pair. A more distant target will be the 1.0321 level where I recommend locking in profits. If EUR/USD drops and bulls show no activity at 1.0171 in the afternoon, the pressure on the euro will escalate. In this case, it is better not to rush to open long positions until a false breakout of 1.0122 occurs. You can buy EUR/USD immediately at a bounce from the level of 1.0082 or even a low of 1.0045, keeping in mind an upward intraday correction of 30-35 pips.
What is needed to open short positions on EUR/USD
Apart from the ECB meeting and a rate increase, traders may shift their attention to US data. The US will unveil economic reports in the afternoon. If EUR/USD makes attempts to advance in the afternoon, a false breakout of 1.0227 will generate an excellent sell signal with the prospect of a fall to the support level of 1.0171. This level is the lower border of the current sideways channel. A new sell signal will appear after a breakout and a drop below this level, as well as an upward test and strong data on the Philadelphia Federal Reserve Manufacturing Index and a decline in the number of initial jobless claims. If so, buyers will have to close their stop-loss orders, pushing the pair down to 1.0122. It will greatly affect traders who expect the pair to remain at previous highs. A decline below 1.0127 will open the way to 1.0082 where I recommend closing all short positions. A more distant target will be the 1.0045 level. If EUR/USD edges higher during the American session and bears show no energy at 1.0227, it is better to postpone short positions until a more attractive resistance level of 1.0271. Only a false breakout of this level will trigger a sell-off. You can open short positions immediately at a bounce from 1.0321 or a high of 1.0374, keeping in mind a downward intraday correction of 30-35 pips.
COT report
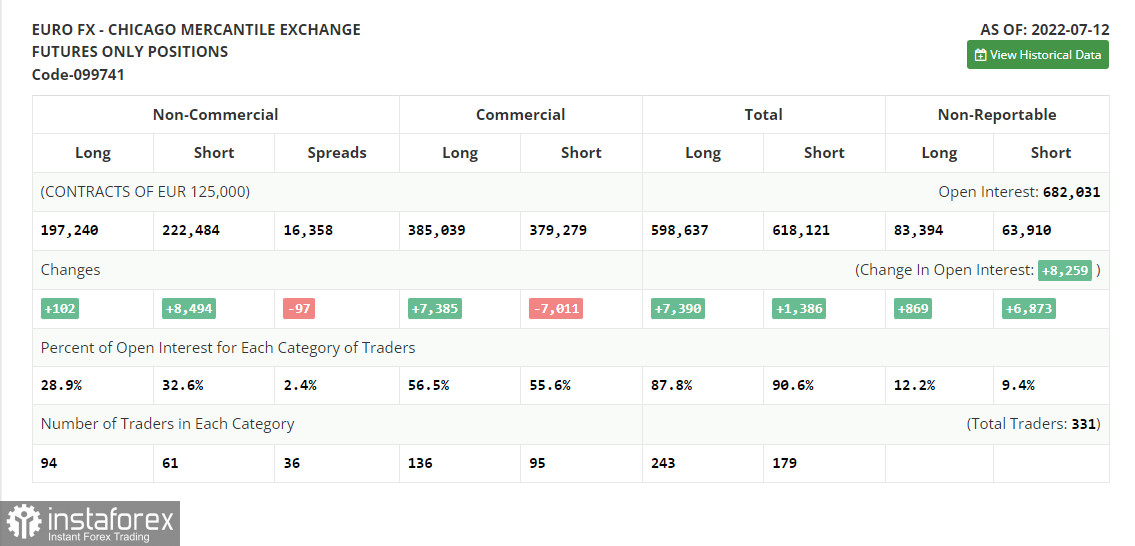
The COT report (Commitment of Traders) for July 12 logged an increase in both long and short positions. However, the number of short positions exceeded the number of long ones. It means that the bears are still in control. It also led to an increase in the negative delta. It seems traders are unwilling to buy the euro even at the current lows. The main reason is strong macro stats from the US. Rising inflation and retail sales facilitated bullish sentiment for the US dollar. As a result, there was a drop in demand for risk assets. as long as the Fed raises the key rate, the US dollar will maintain its bull run. In the near future, the eurozone will unveil its inflation data, which may trigger new sharp price swings. If this scenario comes true, a small upward correction of the pair may take place. Yet, it is will be a short-lived rise. the pair will eventually decline and test the parity level again. The COT report revealed that the number of long non-commercial positions increased by only 102 to the level of 197,240, while the number of short non-commercial positions jumped by 8,494 to the level of 222,484. Despite the low exchange rate of the euro, the US dollar is approaching new highs amid further aggressive monetary tightening by major central banks and the recession in many developed countries. At the end of the week, the total non-commercial net position remained negative and amounted to -25,244 against -16,852. The weekly closing price dropped to 1.0094 against 1.0316.
Signals of technical indicators
Moving averages
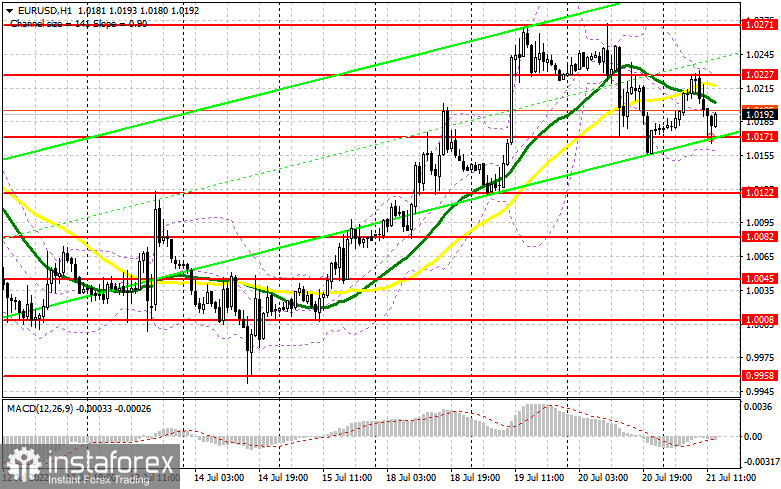
EUR/USD is trading near 30- and 50-period moving averages, signaling market equilibrium ahead of the ECB meeting.
Remark. The author is analyzing the period and prices of moving averages on the 1-hour chart. So, it differs from the common definition of classic daily moving averages on the daily chart.
Bollinger Bands
In case of a rise, the upper border of 1.0227 will act as resistance. A breakout of the lower border at about 1.0150 will escalate pressure on EUR/USD.
Definitions of technical indicators
- Moving average recognizes an ongoing trend through leveling out volatility and market noise. A 50-period moving average is plotted yellow on the chart.
- Moving average identifies an ongoing trend through leveling out volatility and market noise. A 30-period moving average is displayed as the green line.
- MACD indicator represents a relationship between two moving averages that is a ratio of Moving Average Convergence/Divergence. The MACD is calculated by subtracting the 26-period Exponential Moving Average (EMA) from the 12-period EMA. A 9-day EMA of the MACD called the "signal line".
- Bollinger Bands is a momentum indicator. The upper and lower bands are typically 2 standard deviations +/- from a 20-day simple moving average.
- Non-commercial traders - speculators such as retail traders, hedge funds, and large institutions who use the futures market for speculative purposes and meet certain requirements.
- Non-commercial long positions represent the total long open position of non-commercial traders.
- Non-commercial short positions represent the total short open position of non-commercial traders.
- The overall non-commercial net position balance is the difference between short and long positions of non-commercial traders.


