


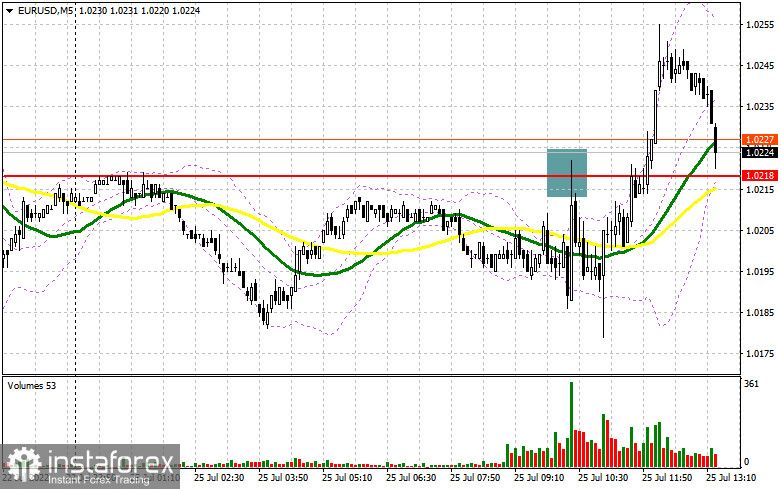
In my morning forecast, I paid close attention to the level of 1.0218 and advocated making entry selections there. Let's examine the 5-minute chart to determine what transpired there. The rise in the area of 1.0218 throughout the first part of the trading day, paired with a failed attempt to consolidate, resulted in a false breakdown and a signal to sell the euro. Consequently, the decline was approximately 30 points, but we did not reach the nearest support. After repeated testing of 1.0218, there was a breakdown of this range, but I could not observe a top-to-bottom reversal update and be obliged to forego the upward movement.
To initiate long positions on the EURUSD, you must:
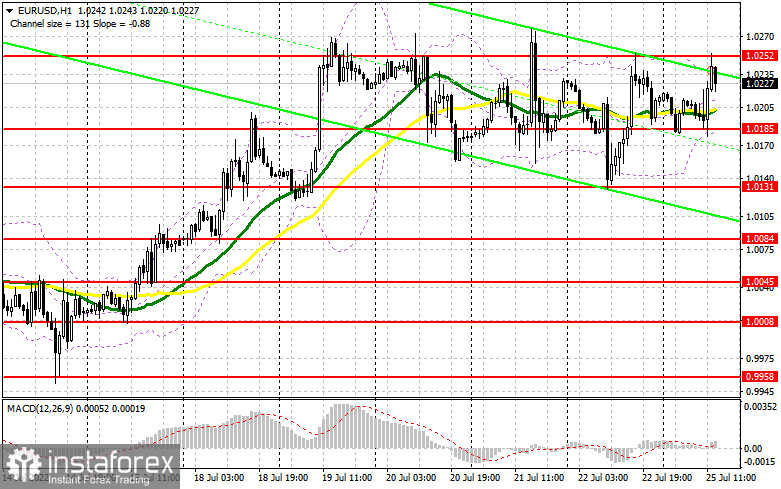
Since we have returned to Friday's highs, euro buyers have every opportunity to continue the upward trend, particularly in light of the decisions made by the European Central Bank last week about interest rates. There are no significant US numbers this afternoon, so we can expect an update of last week's highs. The foreign exchange market has little in common with the national activity index of the Federal Reserve Bank of Chicago and the index of business activity in the manufacturing industry of the Federal Reserve Bank of Dallas. For the bulls not to lose the initiative, they must appear near the level of 1.0185, established at the close of the first half of the trading day. Only after the development of a false breakdown can one anticipate ongoing expansion and an update of the closest resistance level of 1.0252, which has been challenged twice in recent sessions. Now, a great deal hinges on this level. Only a breakthrough and a top-down test of this range will trigger stop orders, signaling entry into long positions with the potential for a new high of 1.0303. A more distant objective will be the area around 1.0374, where I advocate locking in profits. If EUR/USD falls and there are no buyers at 1.0185 in the afternoon, the euro will come under increased pressure. In this case, I suggest you not rush into the market: the ideal entry point for long positions will be a false breakdown in the 1.0131 level. I recommend purchasing EUR/USD immediately for a comeback only from the level of 1.0084, or even lower - around 1.0045, with the goal of a 30-point-per-day upward corrective.
To establish short positions on the EURUSD, you must:
If the EUR/USD continues to rise in the afternoon following the release of US economic data, the creation of a false breakdown at 1.0252 would be the first indication to begin short positions in anticipation of a decline to the support at 1.0185. A breakdown and consolidation below this range, as well as a reverse test from the bottom up, will result in an additional sell signal with the destruction of buyers' stop orders. Moreover, a larger pair movement down to the 1.0131 area will significantly impact speculative traders who anticipate the pair to remain near its previous highs. Fixing below 1.0131 is a direct route to 1.0084, so I propose quitting all sales. The 1.0045 region will serve as a further-off objective. A retest of this level would indicate a continuation of the bearish trend. If there is a rise in EUR/USD during the American session and the lack of bears at 1.0252, I would advise delaying short positions until the more attractive 1.0303 resistance level. Only the emergence of a fake breakdown there will mark the beginning of the euro's selling. Short positions can be reopened immediately from the maximum of 1.0374, or even higher – around 1.0437, with the objective of a 30-35 point correction below.
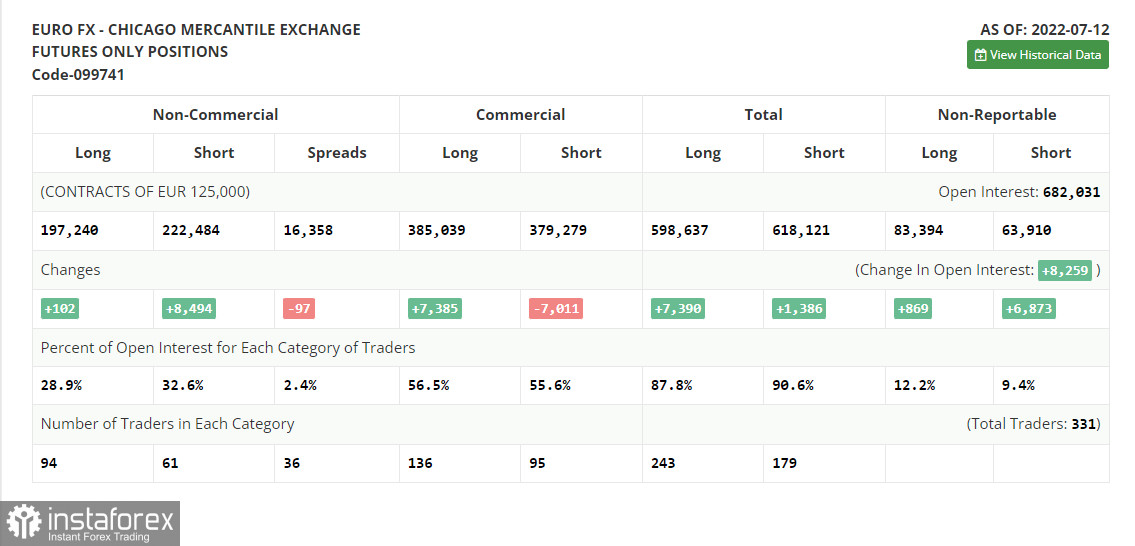
The COT report (Commitment of Traders) for July 12 revealed an increase in both long and short holdings. However, the increase in short positions was significantly larger, indicating the market's persistent bearish attitude. It also contributed to constructing a larger negative delta, as there are fewer buyers even at the current lows. It's all due to excellent data in the United States, where rising inflation and retail sales have maintained bullish sentiment against the US dollar and further weakened demand for riskier assets. The dollar will continue to rise until the Federal Reserve boosts rates. In the near future, it is anticipated that a significant report on inflation in the eurozone will be released, which may signal another surge in price growth. If this occurs, you should not be shocked by a small upward adjustment of the pair, but it is unlikely to prevent a renewed slide and another test of the dollar's parity with the euro. The COT data indicates that the number of long non-profit positions climbed by 102 to 197,240, while the number of short non-profit employment increased by 8,494 to 222,484. Despite the low exchange rate of the euro, the necessity for additional strong Central bank policies, and the recession in many wealthy countries, dollar purchases continue to be encouraged. The total non-commercial net position after the week remained negative at -25,244 vs. -16,852. The weekly ending price decreased from 1.0316 to 1.0094.
- Moving average (moving average determines the current trend by smoothing out volatility and noise). Period 50. The graph is marked in yellow.
- Moving average (moving average determines the current trend by smoothing out volatility and noise). Period 30. The graph is marked in green.
- MACD indicator (Moving Average Convergence / Divergence - moving average convergence/divergence) Fast EMA period 12. Slow EMA period 26. SMA period 9
- Bollinger Bands (Bollinger Bands). Period 20
- Non-profit speculative traders, such as individual traders, hedge funds, and large institutions use the futures market for speculative purposes and to meet certain requirements.
- Long non-commercial positions represent the total long open position of non-commercial traders.
- Short non-commercial positions represent the total short open position of non-commercial traders.
- Total non-commercial net position is the difference between the short and long positions of non-commercial traders.


