


Analysis of Monday's deals:
30M chart of the GBP/USD pair
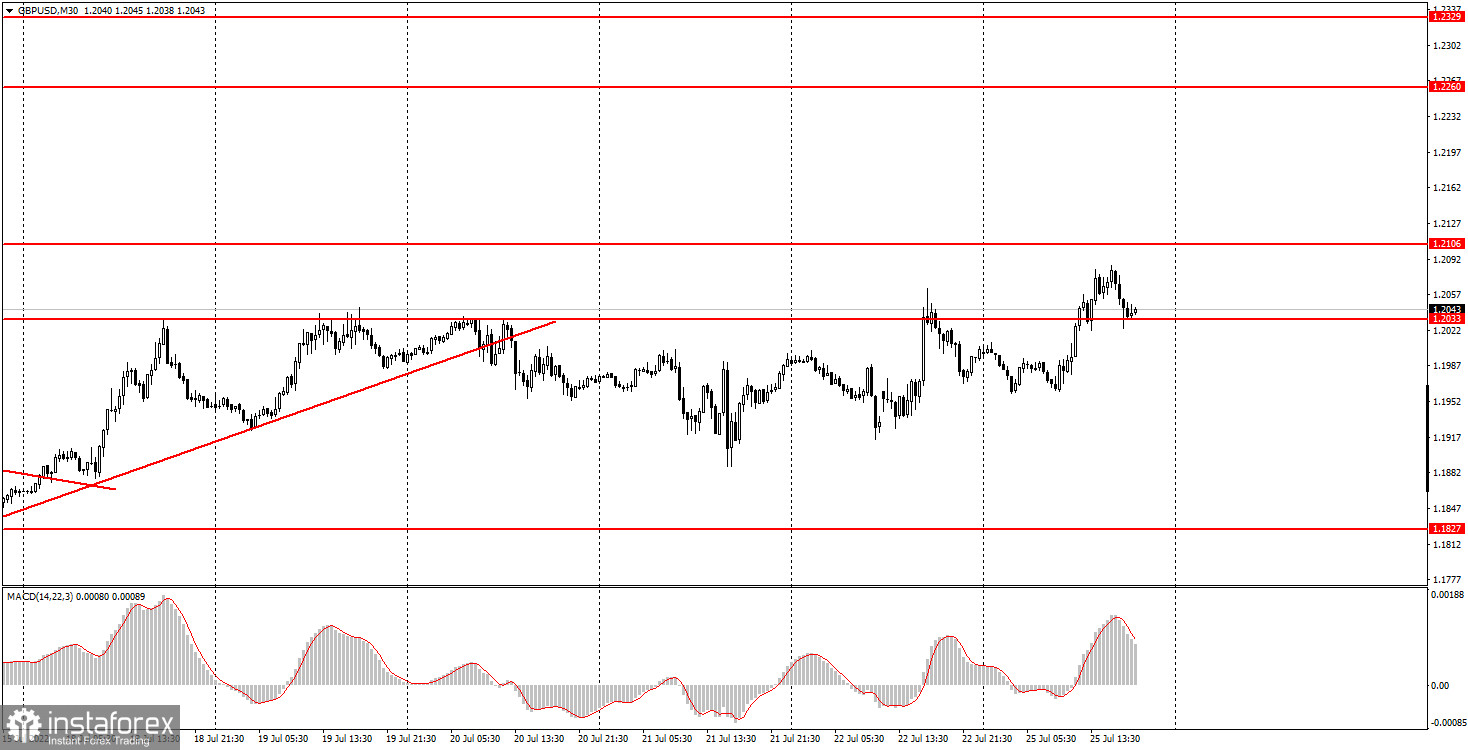
The GBP/USD pair moved much better on Monday. There was at least some trend movement during the day, so it was much more pleasant to trade the pair. Once again, let's draw your attention to the fact that it is difficult to trade in a flat, but easy in a trend. Therefore, we received only false signals for the euro/dollar pair on Monday, and real ones for the pound. However, despite the good movement, the pair is still in a state close to flat on the 30-minute timeframe. There is a minimal upward bias, but there are still big doubts about the British pound's ability to rise in price for a long time and strongly. Especially when the Federal Reserve meeting looms on the horizon, at which the key rate will be raised by 0.75% low. Therefore, we believe that the fall in the pair's quotes may resume almost at any moment. There is no trend line or channel now, so there is nothing to focus on, except for the levels.
5M chart of the GBP/USD pair
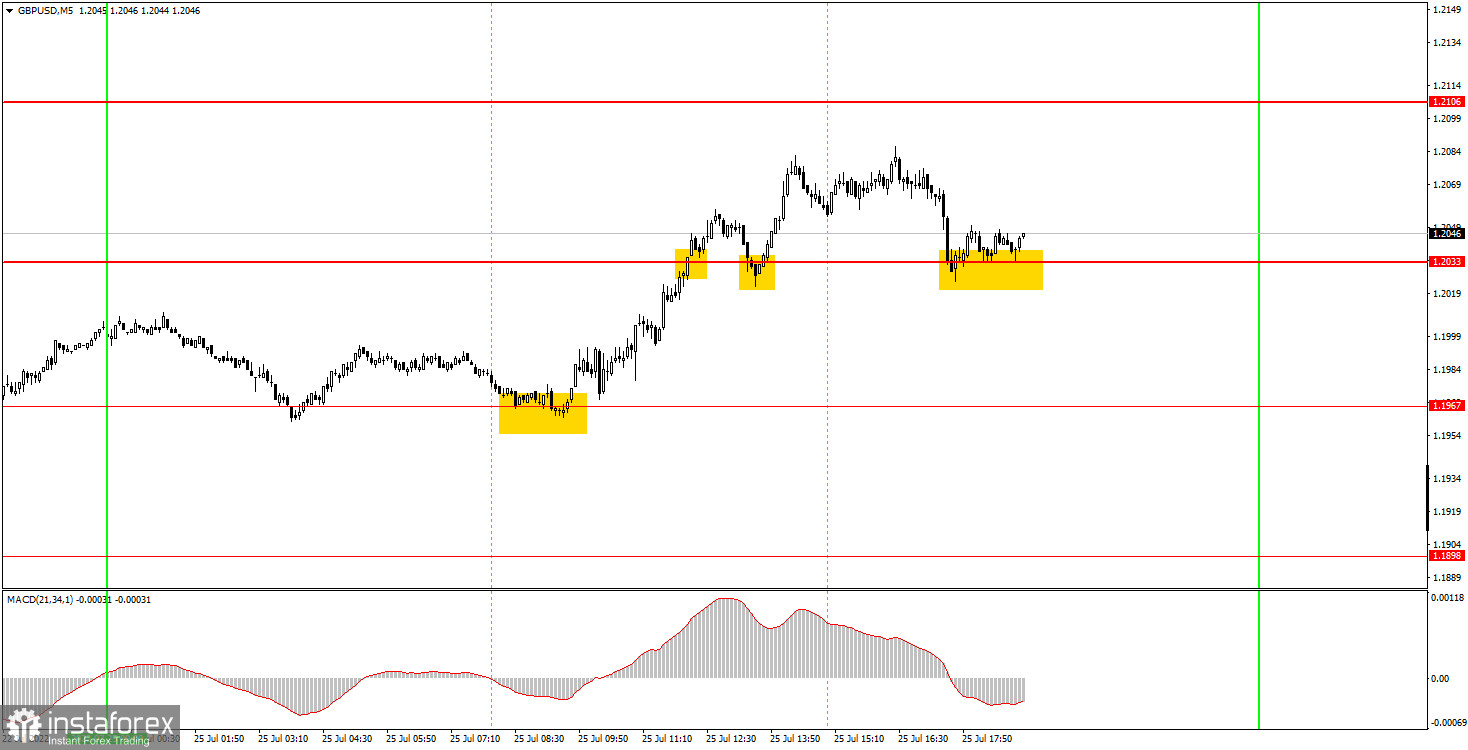
You can clearly see using the 5-minute timeframe what we meant above. Although the pair reversed during the day, some very good signals were formed, which we will now consider. The first signal was formed at the beginning of the European trading session, when the price rebounded from the level of 1.1967. After that, growth began and the pair overcame the level of 1.2033, and then also rebounded from it from above. However, it failed to reach the target level of 1.2106 and by the evening the quotes returned to the level of 1.2033. Thus, it turns out that only one deal should have been opened, and since there was no sell signal, it had to be closed manually in the late afternoon. The profit on it amounted to at least 60 points, which definitely covered the losses on the euro/dollar pair.
How to trade on Tuesday:
The GBP/USD pair is trying to form a new upward trend on the 30-minute time frame after breaking the uptrend line. However, the movement is now incomprehensible and is very similar to a flat. Thus, just in case, we recommend sticking to a cautious trading style. Moreover, European currencies still cannot correct normally within the global downward trend, which means they can start a new fall at any moment. On the 5-minute TF on Tuesday, it is recommended to trade at the levels 1.1807-1.1827, 1.1898, 1.1967, 1.2033, 1.2106, 1.2170. When the price passes after opening a deal in the right direction for 20 points, Stop Loss should be set to breakeven. Again, no major events or publications are scheduled for Tuesday in the UK and US. The market showed at the beginning of the week that it is not eager to trade actively and, it seems, is already waiting for Wednesday evening.
Basic rules of the trading system:
1) The signal strength is calculated by the time it took to form the signal (bounce or overcome the level). The less time it took, the stronger the signal.
2) If two or more deals were opened near a certain level based on false signals (which did not trigger Take Profit or the nearest target level), then all subsequent signals from this level should be ignored.
3) In a flat, any pair can form a lot of false signals or not form them at all. But in any case, at the first signs of a flat, it is better to stop trading.
4) Trade deals are opened in the time period between the beginning of the European session and until the middle of the US one, when all deals must be closed manually.
5) On the 30-minute TF, using signals from the MACD indicator, you can trade only if there is good volatility and a trend, which is confirmed by a trend line or a trend channel.
6) If two levels are located too close to each other (from 5 to 15 points), then they should be considered as an area of support or resistance.
On the chart:
Support and Resistance Levels are the Levels that serve as targets when buying or selling the pair. You can place Take Profit near these levels.
Red lines are the channels or trend lines that display the current trend and show in which direction it is better to trade now.
The MACD indicator (14,22,3) consists of a histogram and a signal line. When they cross, this is a signal to enter the market. It is recommended to use this indicator in combination with trend lines (channels and trend lines).
Important speeches and reports (always contained in the news calendar) can greatly influence the movement of a currency pair. Therefore, during their exit, it is recommended to trade as carefully as possible or exit the market in order to avoid a sharp price reversal against the previous movement.
Beginners on Forex should remember that not every single trade has to be profitable. The development of a clear strategy and money management are the key to success in trading over a long period of time.


