


Analysis of Monday's deals:
30M chart of the EUR/USD pair
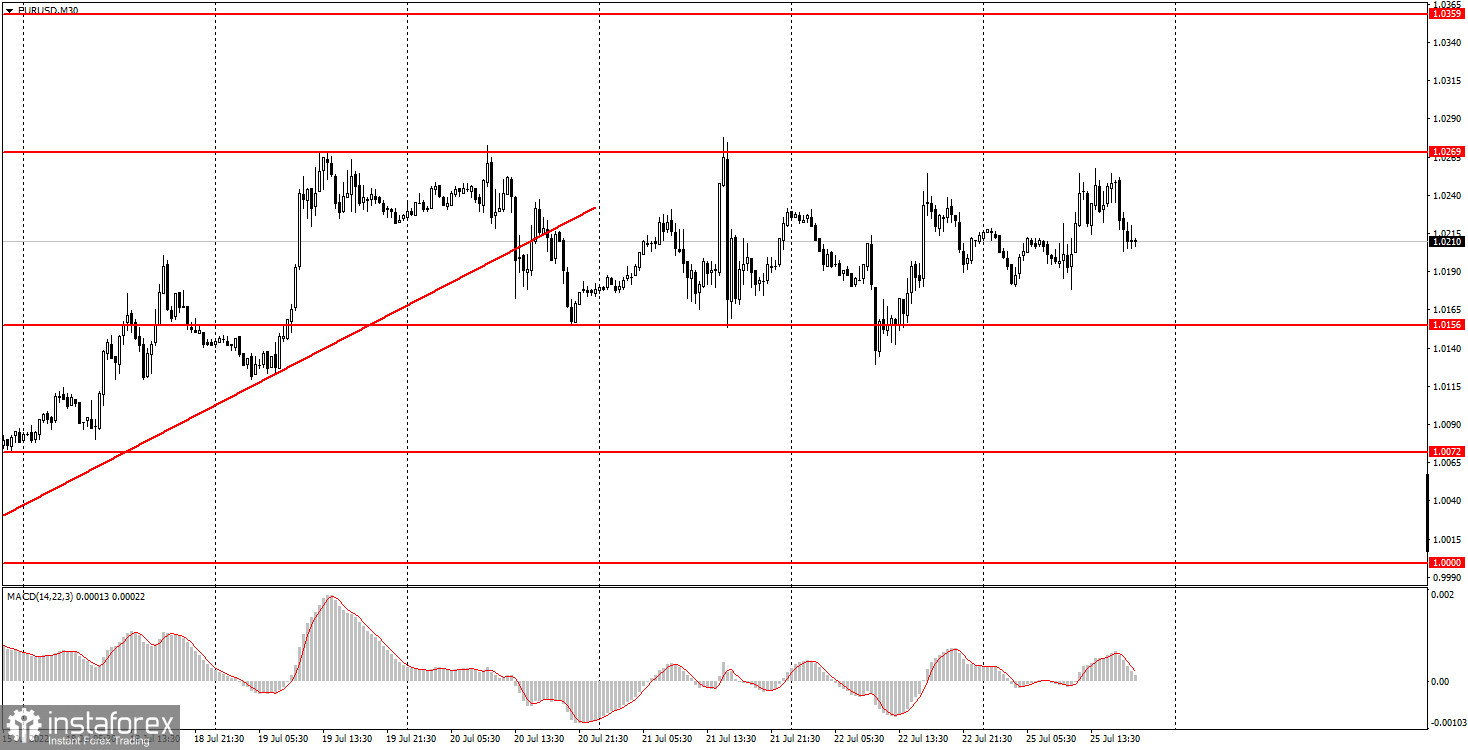
The EUR/USD currency pair did not show anything interesting on Monday. The pair continued to trade inside the horizontal channel of 1.0156-1.0269, which was formed somehow spontaneously, at a time when many were waiting for a trend movement. Recall that last week the European Central Bank met with an unexpected decision to raise the rate by 0.5%, and this week the Federal Reserve will hold a meeting, where there may also be surprises. Thus, a flat is not what one might expect. However, today was a "normal, boring Monday" without a single macro report, without any interesting event. Traders had nothing to pay attention to during the day, so they seem to have already focused on Wednesday, when the results of the Fed meeting will be known. In fact, we are waiting for a new strengthening of the US dollar, since a rate hike of at least 0.75% is already a practically resolved issue. However, the market is in no hurry to resume short positions on the pair, and this is a bit confusing. We assume that the flat will continue even on Wednesday, as the market could take into account any tightening of the Fed's monetary policy.
5M chart of the EUR/USD pair
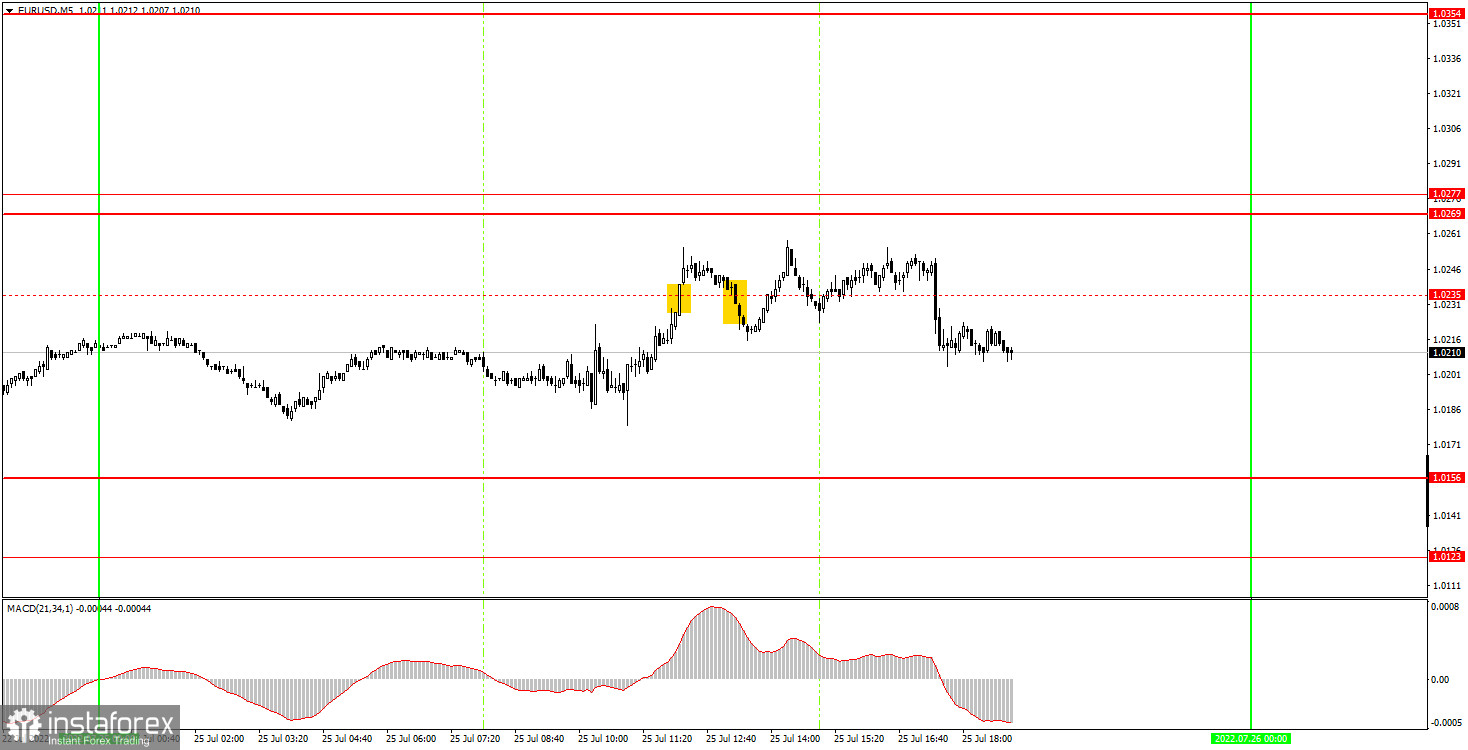
It is clearly seen on the 5-minute timeframe that the movements were weak and there was no trend. All signals of the day were formed around the same level of 1.0235, which was recognized as irrelevant by the end of the day. And all the signals were, in fact, false. Thus, it was worth working out only the first two. In the event of forming a buy signal, the pair managed to go up 10 points, in case of a sell signal - the same amount. That is, even Stop Loss could not be set for both deals. Both suffered a small loss. Unfortunately, these days do happen. We have repeatedly warned that it is always very difficult to trade in a flat, since the pair often does not move from one border to another, it moves between them, far from always working out. Therefore, in the ideal case, you need to wait for a trend to form.
How to trade on Tuesday:
The upward trend has been formally canceled on the 30-minute timeframe. The euro may still continue to rise, but it is much more likely, based on technical analysis, that the fall will resume. But so far there is neither one nor the other. There is a flat! Thus, either you should wait for the end of the flat, or trade as carefully as possible, since false signals are often formed in the flat. On the 5-minute TF on Tuesday, it is recommended to trade at the levels of 1.0072, 1.0123, 1.0156, 1.0269-1.0277, 1.0354. When passing 15 points in the right direction, you should set Stop Loss to breakeven. No interesting events or reports planned in the European Union and America on Tuesday. Thus, it will be a completely empty day, and the pair may remain inside the horizontal channel, that is, in a flat. This moment should be taken into account when opening any positions.
Basic rules of the trading system:
1) The signal strength is calculated by the time it took to form the signal (bounce or overcome the level). The less time it took, the stronger the signal.
2) If two or more deals were opened near a certain level based on false signals (which did not trigger Take Profit or the nearest target level), then all subsequent signals from this level should be ignored.
3) In a flat, any pair can form a lot of false signals or not form them at all. But in any case, at the first signs of a flat, it is better to stop trading.
4) Trade deals are opened in the time period between the beginning of the European session and until the middle of the US one, when all deals must be closed manually.
5) On the 30-minute TF, using signals from the MACD indicator, you can trade only if there is good volatility and a trend, which is confirmed by a trend line or a trend channel.
6) If two levels are located too close to each other (from 5 to 15 points), then they should be considered as an area of support or resistance.
On the chart:
Support and Resistance Levels are the Levels that serve as targets when buying or selling the pair. You can place Take Profit near these levels.
Red lines are the channels or trend lines that display the current trend and show in which direction it is better to trade now.
The MACD indicator (14,22,3) consists of a histogram and a signal line. When they cross, this is a signal to enter the market. It is recommended to use this indicator in combination with trend lines (channels and trend lines).
Important speeches and reports (always contained in the news calendar) can greatly influence the movement of a currency pair. Therefore, during their exit, it is recommended to trade as carefully as possible or exit the market in order to avoid a sharp price reversal against the previous movement.
Beginners on Forex should remember that not every single trade has to be profitable. The development of a clear strategy and money management are the key to success in trading over a long period of time.


