


When to go long on EUR/USD:
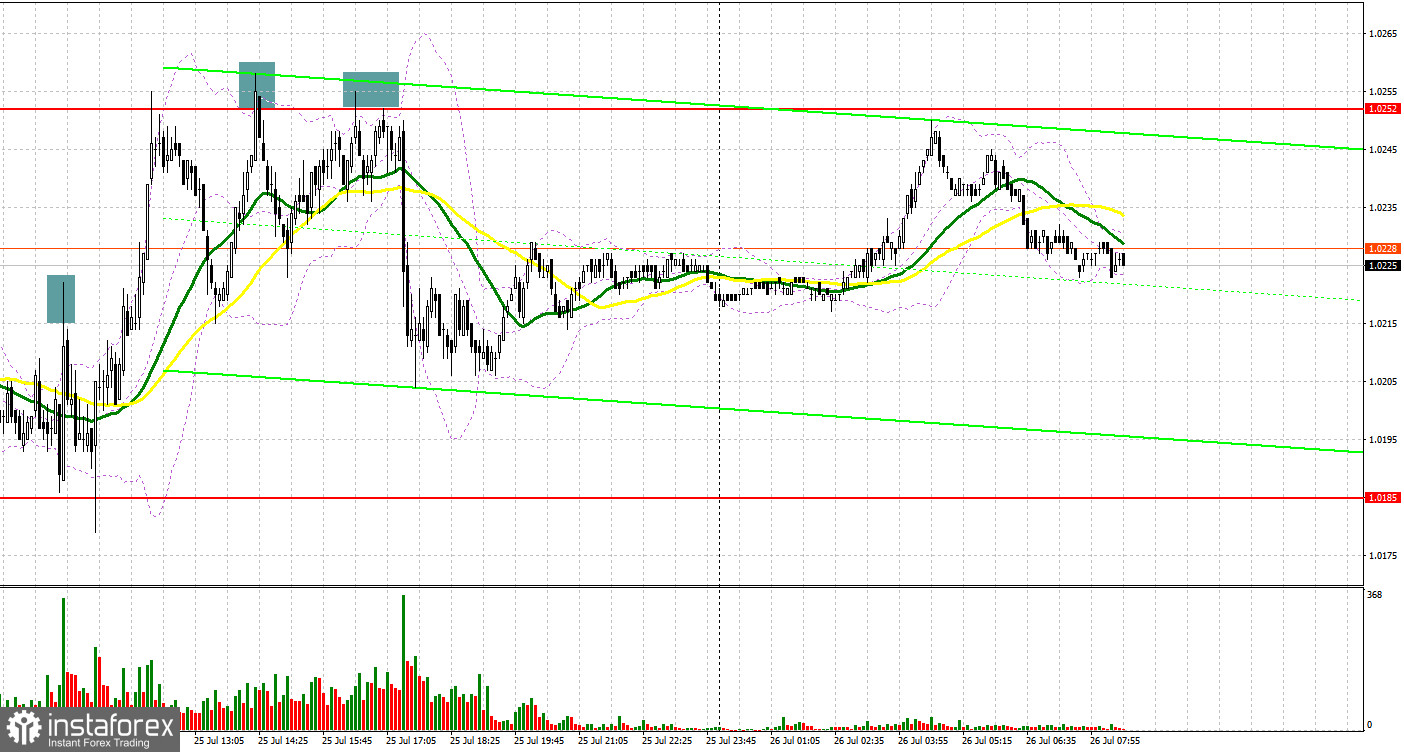
Several excellent market entry signals were formed yesterday. I suggest you take a look at the 5-minute chart and figure out what happened. I paid attention to the 1.0218 level in my morning forecast and advised you to make decisions on entering the market. Growth to the area of 1.0218 in the first half of the day and failure to consolidate led to a false breakout and a signal to sell the euro. As a result, the downward movement amounted to about 30 points, but we did not reach the nearest support. After a second test of 1.0218, this range was broken, however, I did not see a reverse update from top to bottom and was forced to miss the upward movement. As a result of the resistance update at 1.0252 in the afternoon, it was possible to observe a false breakout and a signal to sell the euro. As a result, the pair fell by more than 50 points from the entry point by the end of the US session.
COT report:
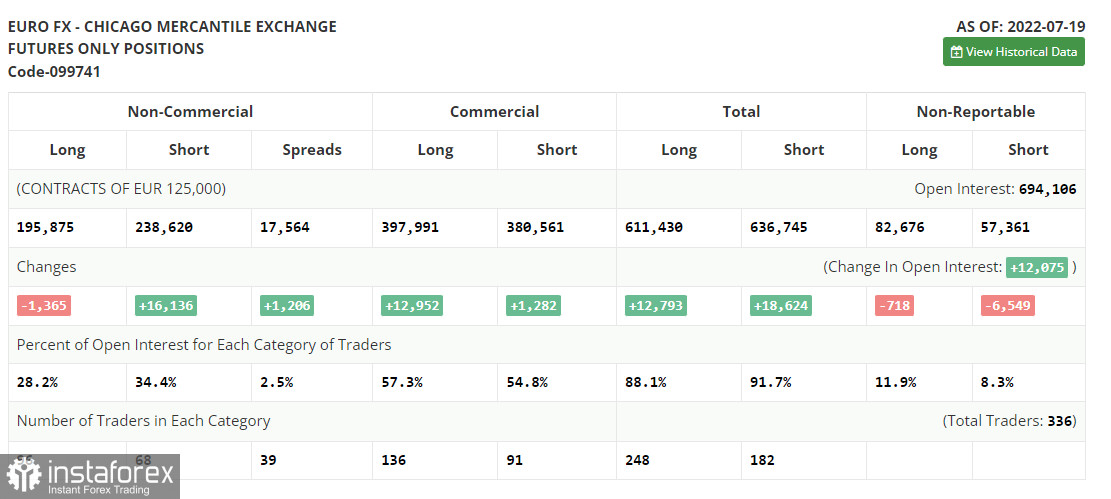
Before talking about the further prospects for the EUR/USD movement, let's look at what happened in the futures market and how the Commitment of Traders positions have changed. The Commitment of Traders (COT) report for July 19 logged an increase in short positions and a reduction in long positions, which indicates that the bearish sentiment in the market remains. This has also resulted in a larger negative delta, suggesting that there are still not as many bulls as one might think. Last week, the European Central Bank raised interest rates by 0.5% at once, which was beyond the expected forecast of 0.25%. This indicates the seriousness of the situation in the euro area with inflation. However, the markets reacted poorly to this decision, and traders took a wait-and-see attitude before an important Federal Reserve meeting, the results of which will be known in the middle of this week. The fact that the euro has not risen once again indicates the likelihood of a further decline in risky assets this autumn, since there are no real reasons for the EUR/USD to strengthen: high inflation, a crisis in the energy market and the economy is rapidly slipping into recession. The COT report indicated that long non-commercial positions decreased by 1,365 to 195,875, while short non-commercial positions jumped 16,136 to 238,620. At the end of the week, the total non-commercial net position remained negative and amounted to -42,745 against -25,244. The weekly closing price slightly increased and amounted to 1.0278 against 1.0094.
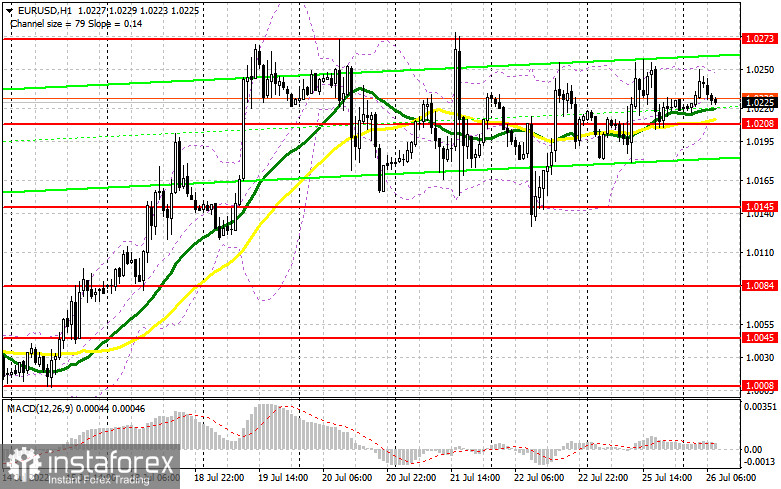
The euro is stuck in a fairly wide horizontal channel, and the pair is unlikely to be able to get out of there before the Fed's decision. Today, there are no statistics on the euro area at all, which could somehow put pressure on the pair, or support it. Therefore, everyone will most likely pay attention to the US session, although I do not expect a particularly directed movement there either. Most likely, the struggle will unfold for a new support level of 1.0208 in the first half of the day, where moving averages, playing on the side of bulls, pass. You can count on a further upward correction after forming a false breakout at this level. The nearest target will be resistance at 1.0273 – last week's high, surpassing the area above which will be quite problematic. A breakthrough and test of this range would hit the bears' stops, providing a signal to enter long positions with the possibility of a bigger upward trend towards 1.0323. A more distant target will be the area of 1.0374, where I recommend taking profits.
In case EUR/USD falls and absence of bulls at 1.0208, which is more likely, the pressure on the euro will seriously increase again. In this case, I advise you not to rush to enter the market: the best option for opening long positions would be a false breakout near the lower border of the horizontal channel at 1.0145. I advise you to buy EUR/USD immediately on a rebound only from the level of 1.0084, or even lower - in the region of 1.0045, counting on an upward correction of 30-35 points within the day.
When to go short on EUR/USD:
As long as the trading will be conducted below 1.0273, the bears will have every chance for the market to turn in their direction and to complete the upward correction observed recently. In case EUR/USD grows in the first half, forming a false breakout near the nearest resistance at 1.0273 creates a signal to open short positions with the prospect of EUR/USD decline and return to support 1.0208 – the middle of the horizontal channel, on which little depends. A breakthrough and consolidation below this range, as well as a reverse test from the bottom up, will lead to another sell signal with the removal of bulls' stop orders and a larger downward movement of the pair to the 1.0145 area, where bulls will have to show themselves. A breakthrough and consolidation below is a direct road to 1.0084, where I recommend completely leaving short positions. A more distant target will be the area of 1.0045.
In case EUR/USD moves up during the European session, as well as the absence of bears at 1.0273, I advise you to postpone shorts until a more attractive resistance at 1.0323. Forming a false breakout there may be a new starting point in hopes of a return of the bear market. I advise you to sell EUR/USD immediately on a rebound only from the high of 1.0374, or even higher - in the region of 1.0437, counting on a downward correction of 30-35 points.
Indicator signals:
Moving averages
Trading is above 30 and 50 moving averages, which indicates a continuation of the upward correction.
Note: The period and prices of moving averages are considered by the author on the H1 hourly chart and differs from the general definition of the classic daily moving averages on the daily D1 chart.
Bollinger Bands
A breakthrough of the lower border of the indicator in the area of 1.0208 will push the euro to fall. Surpassing the upper limit of the indicator in the area of 1.0245 can push the euro to rise.
Description of indicators
- Moving average (moving average, determines the current trend by smoothing out volatility and noise). Period 50. It is marked in yellow on the chart.
- Moving average (moving average, determines the current trend by smoothing out volatility and noise). Period 30. It is marked in green on the chart.
- MACD indicator (Moving Average Convergence/Divergence — convergence/divergence of moving averages) Quick EMA period 12. Slow EMA period to 26. SMA period 9
- Bollinger Bands (Bollinger Bands). Period 20
- Non-commercial speculative traders, such as individual traders, hedge funds, and large institutions that use the futures market for speculative purposes and meet certain requirements.
- Long non-commercial positions represent the total long open position of non-commercial traders.
- Short non-commercial positions represent the total short open position of non-commercial traders.
- Total non-commercial net position is the difference between short and long positions of non-commercial traders.


