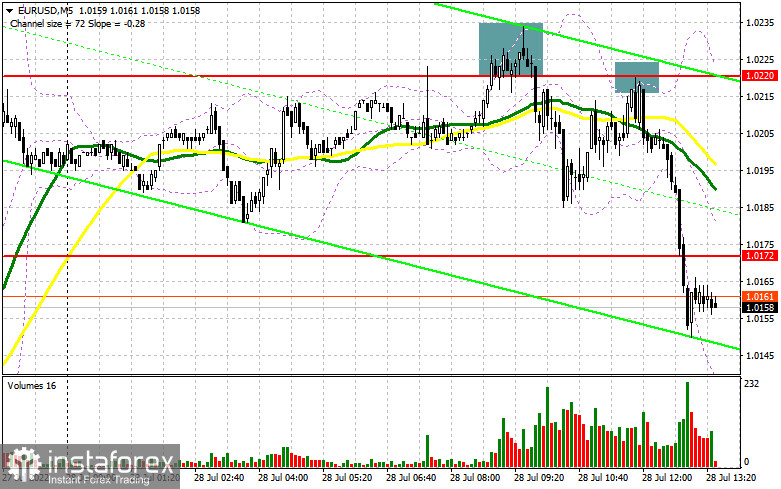
In my forecast this morning, I drew your attention to the level of 1.0220 and recommended entering the market from it. Let's have a look at the 5-minute chart and see what happened there. Yesterday's bullish rally continued today, and the pair failed to fix above 1.0220. These two factors gave a strong sell signal for the euro. After that, the pair fell by 30 pips. If you did not manage to use this momentum, you could always sell the euro after another rising movement towards 1.0220 and a similar false breakout. This time the pair declined by more than 70 pips. From the technical point of view, in the second half of the day, the picture has changed drastically.

Long positions on EUR/USD:
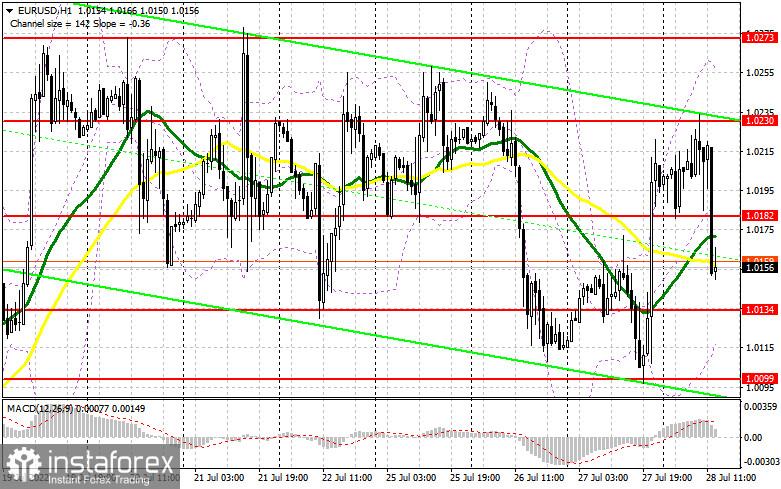
Traders rushed to lock in profits before the release of the US GDP report in Q2 2022. Some expect the economy to grow by 0.4% and some are predicting it to shrink by more than 1.0%. The pair's next move will depend on the US GDP results. After the weak or negative GDP data, the demand for the US dollar being a protective asset may return and we may see the EUR/USD going down and coming back to the weekly lows, establishing a bear market. Therefore, it is very important how the bulls behave around the nearest support at 1.0134. Only a false breakout at this level, after the US data release, is likely to give a signal to buy the euro to continue yesterday's bullish rally, with the prospect of returning to 1.0182. Below this level, the moving averages are passing. These MAs limit the upside potential of the pair. Only a breakthrough and a test of 1.0182 may trigger sellers' Stop Loss orders, giving a signal for entry into long positions, counting on a rise to the level of 1.0230, formed in the first half of the day. The next target is at 1.0273, where you may take profits. In the case of EUR/USD decline and the lack of buyers' activity at 1.0134, the pressure on the pair is likely to increase, as the uptrend will be under threat. In this case, it would be better not to rush to enter the market because a false breakout at 1.0099 will be the best chance to open long positions, which is the last hope of bulls. You may also buy the euro on a rebound from 1.0045, or even lower near 1.0008, allowing an upward intraday correction of 30-35 pips.
Short positions on EUR/USD:
The euro may plummet and it depends on the GDP report. If you missed the morning sell entry points, the best scenario for the second half of the day would be the euro going up to 1.0182. An upward movement can occur in the case of a strong report, but bullish momentum is unlikely to develop. Only a false breakout at 1.0182 may give a signal for the opening of short positions, with the EUR/USD likely to fall to the support of 1.0134. A breakthrough and consolidation below this level, as well as a reverse bottom/top test, will lead to an additional sell signal, triggering buyers' Stop Loss orders and the pair going down to 1.0099. This is likely to strongly affect speculative traders, who expect the pair to remain within the sideways channel. If the pair fixes below 1.0099, it may drop to 1.0045, where you can close your short positions and lock in profits. The next target is located in the area of 1.0008. If the EUR/USD pair increases during the US session, and we see a lack of bearish activity at 1.0182, it would be better to postpone opening short positions until the pair reaches resistance of 1.0230. Only a false breakout at this level would create a possibility to sell the euro. Short positions on the rebound can be considered from the high of 1.0273, or even higher near 1.0323, allowing a downward correction of 30-35 pips.

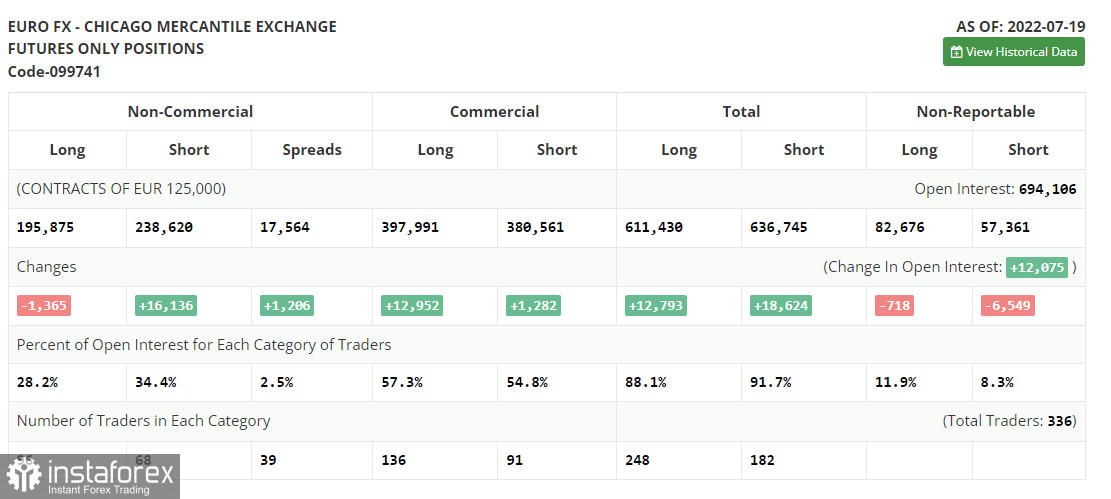
The COT report for July 19 logged an increase in short positions and a decrease in long positions, indicating the continued bearish sentiment in the market. It also led to a larger negative delta and suggests that there are still not so many willing to buy the euro as one might think. Last week, the European Central Bank raised interest rates by 0.5% at once, which was beyond the expected 0.25%. This indicates the severity of the eurozone's inflation. However, markets reacted weakly to this decision and traders took a wait-and-see attitude ahead of an important Fed meeting, the results of which will be released in the middle of this week. The fact that the euro has not risen again points to the possibility of further declines in risky assets this fall, as there are no real reasons for the EUR/USD pair to strengthen. High inflation, the energy market crisis, and the economy sliding rapidly into recession are not supportive at all. The COT report indicates that long non-commercial positions fell by 1,365 to 195,875, while short non-commercial positions jumped by 16,136 to 238,620. At the end of the week, the total non-commercial net position remained negative at -42,745 against -25,244. The weekly closing price rose slightly to 1.0278 against 1.0094.
- Moving average defines the current trend by smoothing out volatility and market noise. Period 50. Marked in yellow on the chart.
- Moving average defines the current trend by smoothing out volatility and market noise. Period 30. Marked in green on the chart.
- MACD (Moving Average Convergence/Divergence) indicator Fast EMA of period 12. Slow EMA period 26. SMA period 9
- Bollinger Bands. Period 20
- Non-commercial traders are speculators, such as individual traders, hedge funds, and large institutions, which use the futures market for speculative purposes and meet certain requirements.
- Long non-commercial positions represent the total long open position of non-commercial traders.
- Short non-commercial positions represent the total short open position of noncommercial traders.
- Total non-commercial net position is the difference between short and long positions of non-commercial traders.


