


EUR/USD 5M
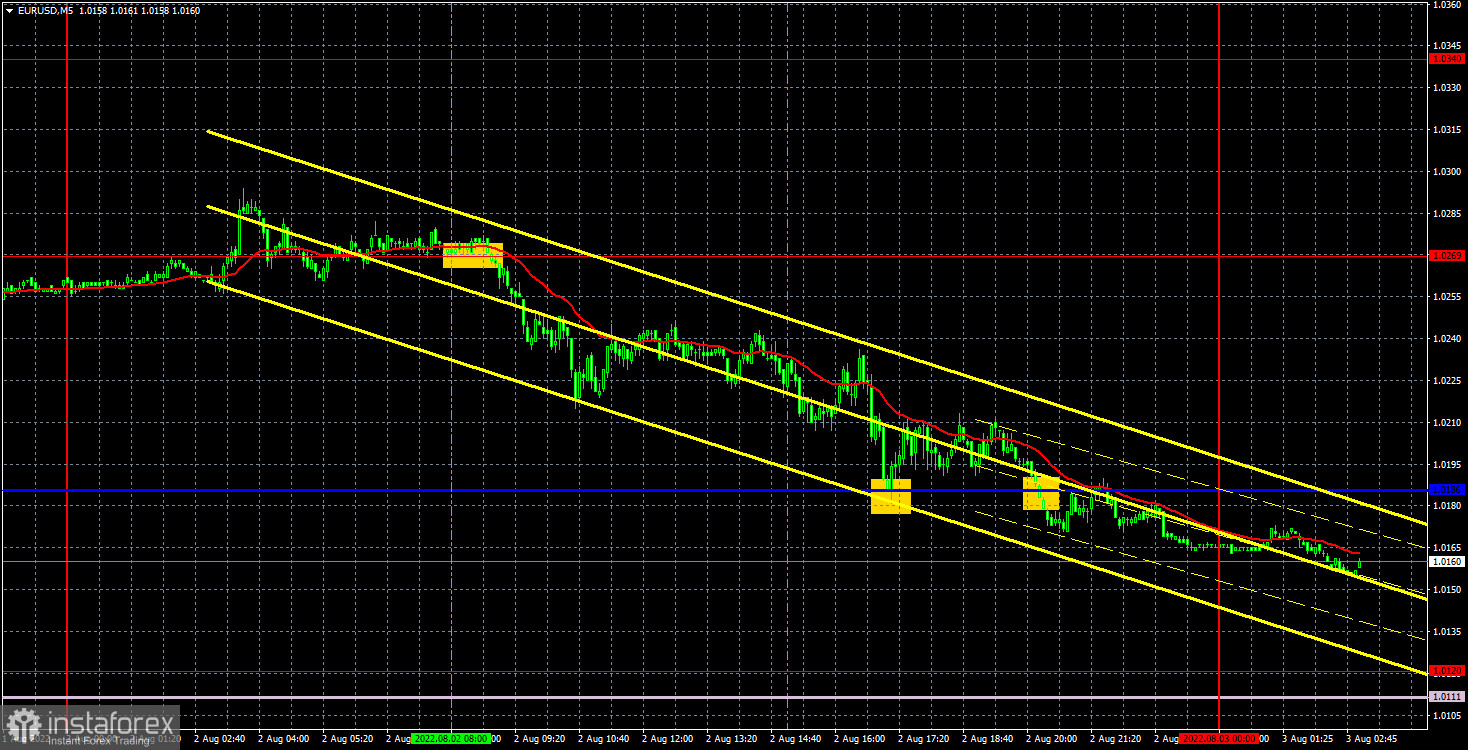
The EUR/USD pair failed to continue its upward movement on Tuesday. Once again. However, in this case, the pair first worked out and even overcame the level of 1.0269, which is the upper boundary of the horizontal channel, but after that it still fell. Neither the United States nor the European Union published a single important report on Tuesday, and the main event of the week was the epic visit of US Congress Speaker Nancy Pelosi to Taiwan. It is the complication of the geopolitical situation in this region that could benefit the US dollar, which tends to rise in price in such cases. However, it should be immediately noted that the technical picture has not changed at all. The pair is still trading inside the horizontal channel of 1.0120-1.0269. And we still believe that sooner or later the US currency will resume its long-term growth and renew 20-year highs. So far, the price is moving towards the lower border of the horizontal channel and will try to overcome it.
There were few technical signals on Tuesday, but they were of the highest quality. A sell signal was formed near the level of 1.0269 at the very beginning of the European trading session, and later the pair fell to the critical line of 1.0186, from which it rebounded ideally in terms of accuracy. Short positions should have been closed in profits of about 70 points here. The buy signal also had to be worked out, but the price managed to go up after it formed by only 20 points, which, however, was enough to place a Stop Loss order at breakeven. Therefore, this deal closed to zero. The pair managed to settle below the critical line yesterday, but this signal was formed too late to work it out.
COT report:
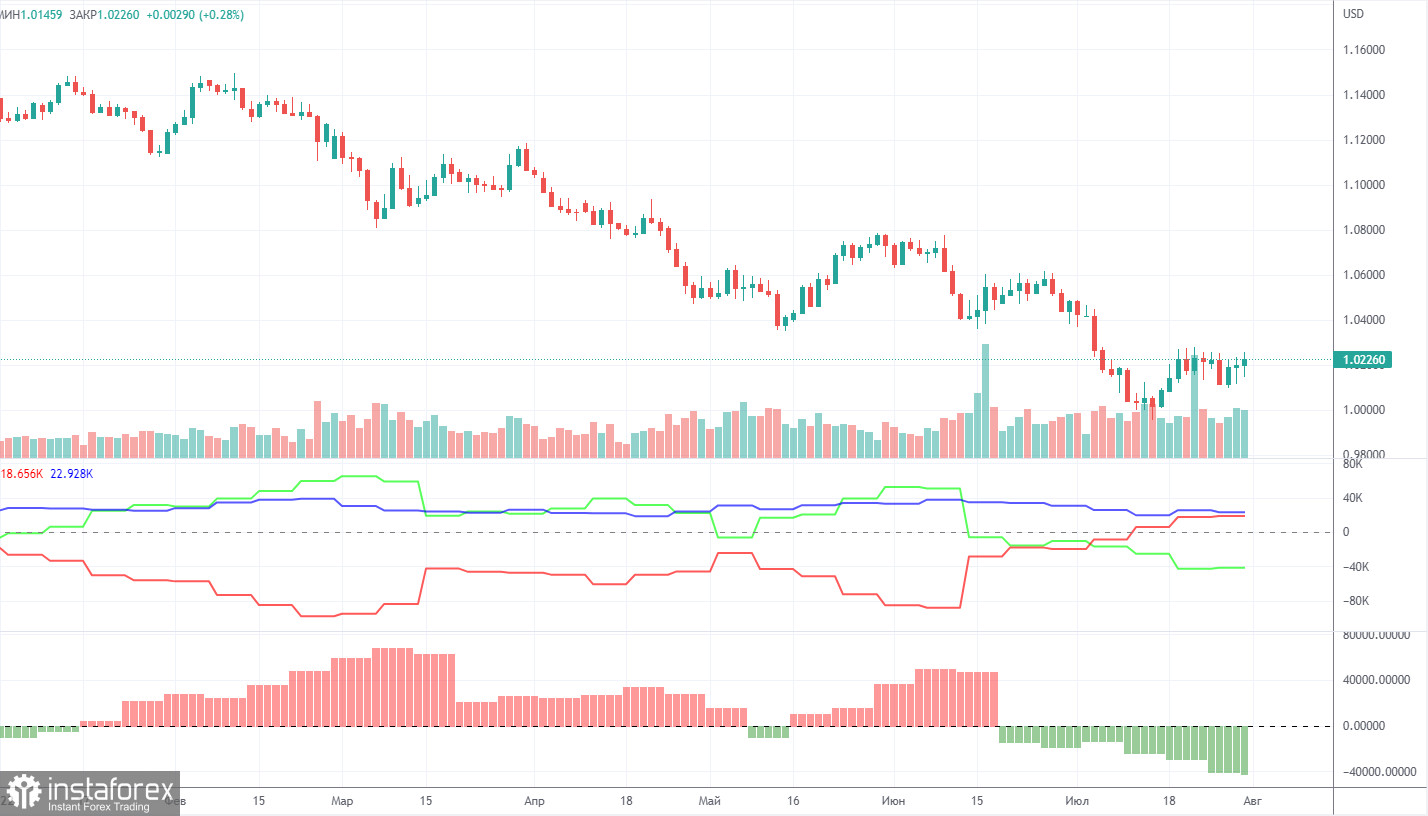
Commitment of Traders (COT) reports on the euro over the past six months have raised a huge number of questions. The chart above clearly shows that for most of 2022 they showed a blatant bullish mood of commercial players, but at the same time, the euro was falling. The situation has changed at this time, but NOT in favor of the euro. If earlier the mood was bullish, but the euro was falling, now the mood is bearish and... the euro is also falling. Therefore, for the time being, we do not see any grounds for the euro's growth, because the vast majority of factors remain against it. During the reporting week, the number of long positions increased by 2,100, and the number of shorts in the non-commercial group increased by 1,000. Accordingly, the net position increased, but only by 1,000 contracts. The sentiment of the big players remains bearish and has continued to pick up in recent weeks. From our point of view, this fact very eloquently indicates that at this time even commercial traders do not believe in the euro. The number of longs is lower than the number of shorts for non-commercial traders by 41,000. Therefore, we can state that not only the demand for the US dollar remains high, but also the demand for the euro is quite low. This may lead to a new, even greater fall of the euro. In principle, over the past few months or even more, the euro has not been able to show even a tangible correction, not to mention something more. The maximum upward movement was about 400 points.
We recommend to familiarize yourself with:
Overview of the EUR/USD pair. August 3. And, in fact, why was there such a fuss around Nancy Pelosi's visit to Taiwan?
Overview of the GBP/USD pair. August 3. Pound, calm down! The British currency continues to grow before the Bank of England meeting.
Forecast and trading signals for GBP/USD on August 3. Detailed analysis of the movement of the pair and trading transactions.
EUR/USD 1H
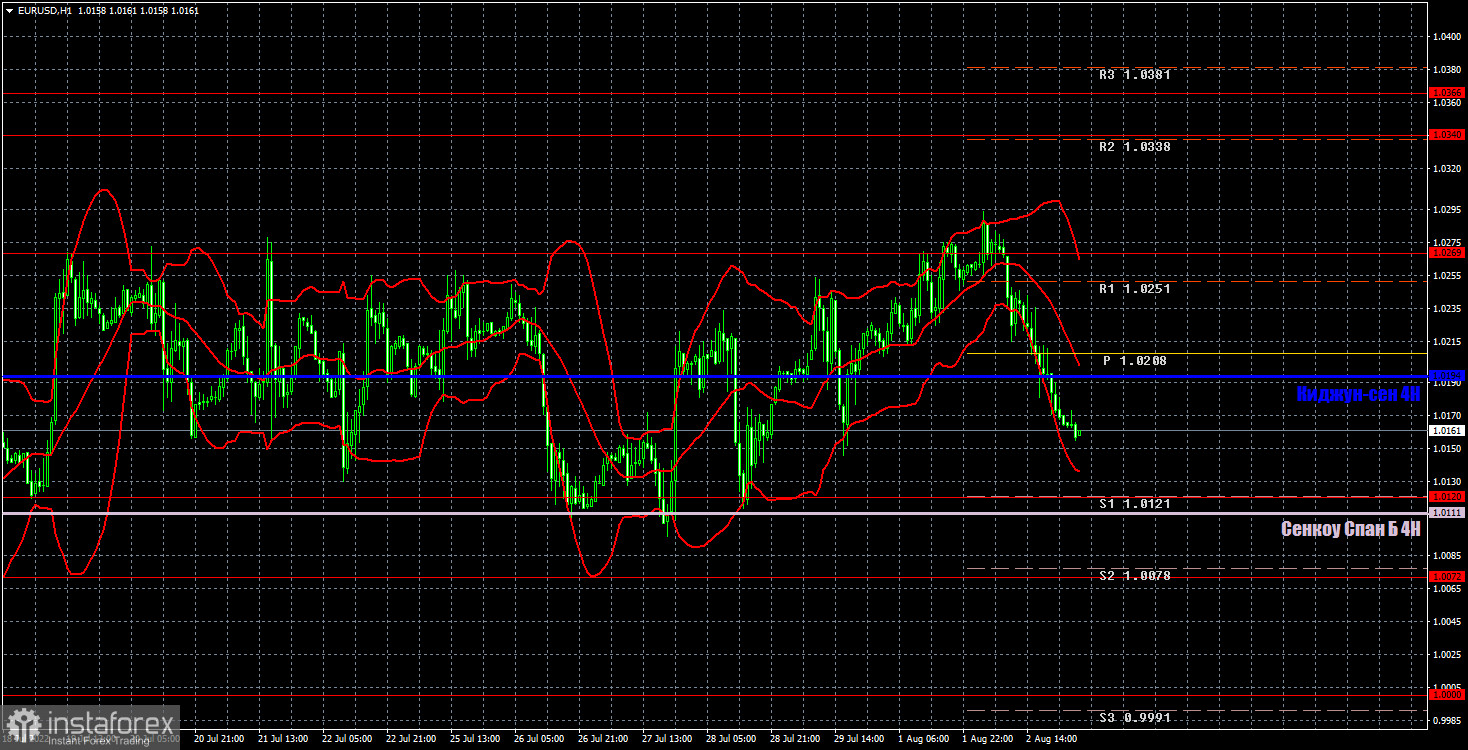
The pair continues to trade between the levels of 1.0120 and 1.0269 on the hourly timeframe. Thus, the flat remains and may continue for some time. The lines of the Ichimoku indicator are not strong now, but, as yesterday showed, strong signals can form around them. We allocate the following levels for trading on Wednesday - 1.0000, 1.0072, 1.0120, 1.0269, 1.0340-1.0366, 1.0485, as well as Senkou Span B (1.0111) and Kijun-sen (1.0194) lines. Ichimoku indicator lines can move during the day, which should be taken into account when determining trading signals. There are also secondary support and resistance levels, but no signals are formed near them. Signals can be "rebounds" and "breakthrough" extreme levels and lines. Do not forget about placing a Stop Loss order at breakeven if the price has gone in the right direction for 15 points. This will protect you against possible losses if the signal turns out to be false. The EU and the US will release only indexes of business activity in the services sector, and there is also another report on retail sales in the EU. We do not consider these data to be extremely important, so we do not expect a strong reaction to them.
Explanations for the chart:
Support and Resistance Levels are the levels that serve as targets when buying or selling the pair. You can place Take Profit near these levels.
Kijun-sen and Senkou Span B lines are lines of the Ichimoku indicator transferred to the hourly timeframe from the 4-hour one.
Support and resistance areas are areas from which the price has repeatedly rebounded off.
Yellow lines are trend lines, trend channels and any other technical patterns.
Indicator 1 on the COT charts is the size of the net position of each category of traders.
Indicator 2 on the COT charts is the size of the net position for the non-commercial group.


