


GBP/USD 5M
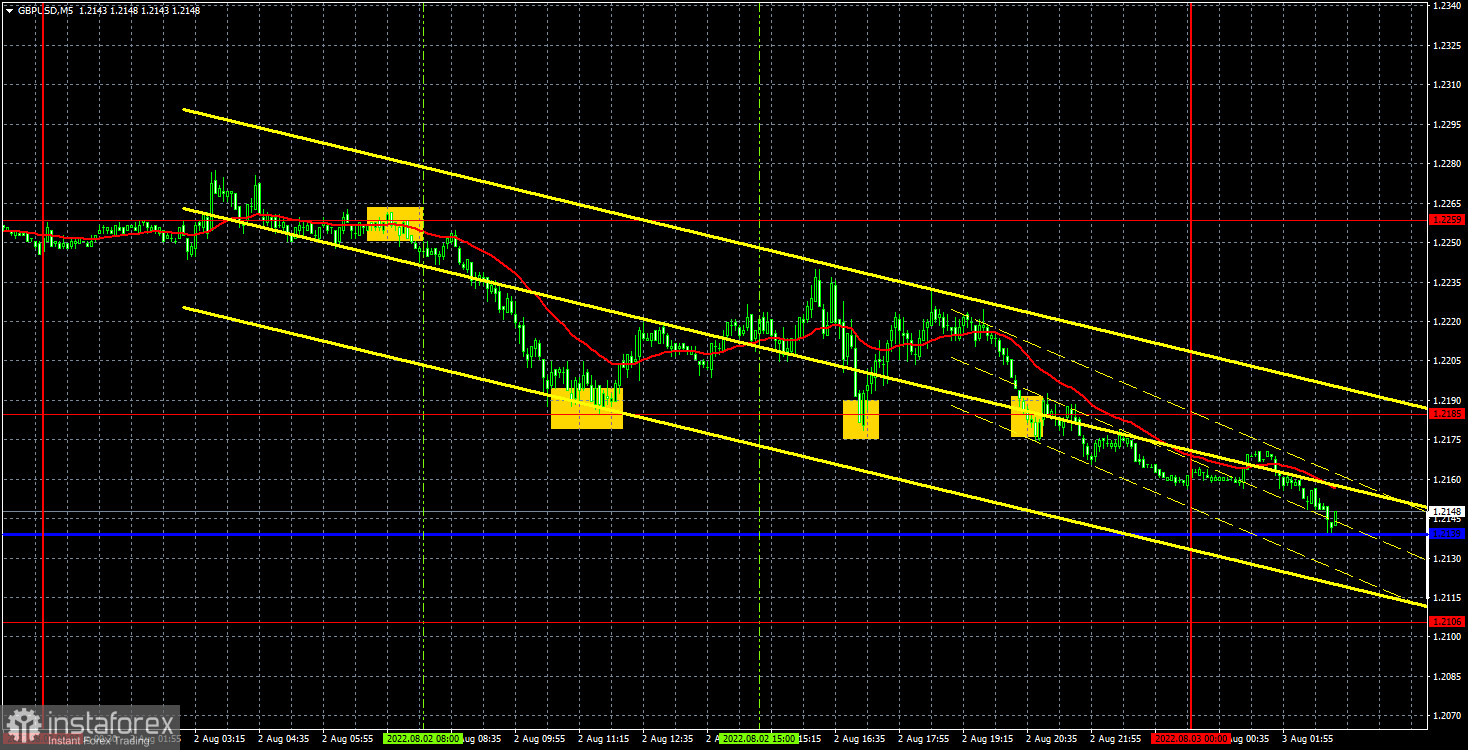
The GBP/USD currency pair also fell for most of the day on Tuesday. We associate this movement with the tension of the geopolitical situation in the world, although it should be recognized that the pound/dollar pair (as well as the euro/dollar pair) has regularly rolled back down before. That is, from the point of view of technical analysis, we are now witnessing a simple round of corrective movement within an upward trend, which should not necessarily have been provoked by something. However, the pair is again approaching the ascending trend line and may try to overcome it again. We also recall that the Bank of England will announce the results of its own meeting tomorrow and this may be the beginning of the end of the pound's growth, as traders have already managed to work out a possible increase in the key rate several times. No important macroeconomic statistics were published either in the US or in the UK, but the pair continued to move quite volatilely, like on almost any other day in the past few months.
There were few trading signals on Tuesday, but they were all quite good. The first sell signal was formed literally 15 minutes before the opening of the European trading session, but it could still be worked out, since at the time of opening, the price had not gone far down. Subsequently, the price dropped to the extreme level of 1.2185, which made it possible for traders to take profit of about 50 points. The rebound from the level of 1.2185 was a buy signal, which also had to be worked out. The pair bounced off this level two more times a little later. The last bounce was formed too late, so it should not have been worked out, and the first two were closed by Stop Loss at breakeven, since each time the price went up more than 20 points, but could never reach the target level of 1.2259.
COT reports:
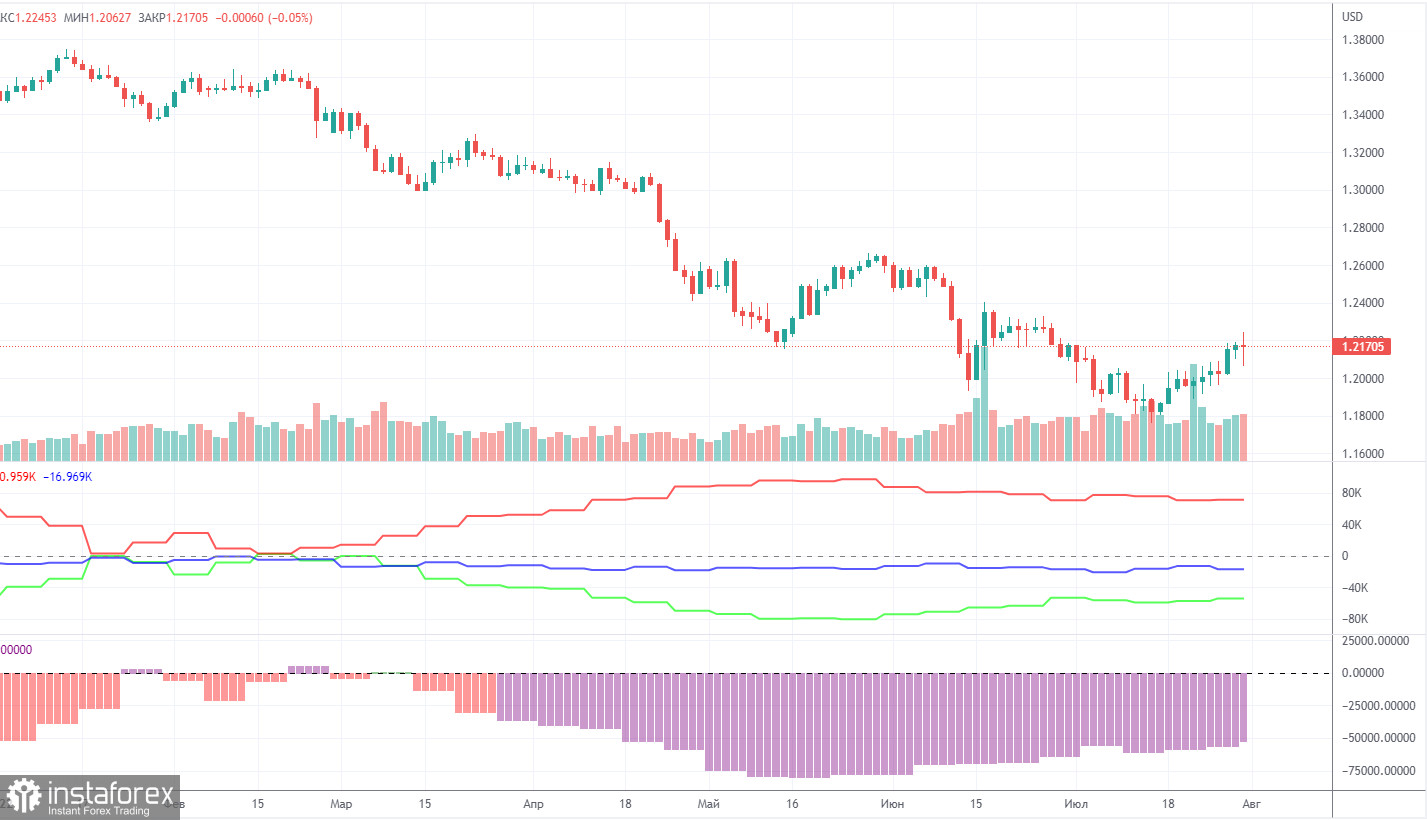
The latest Commitment of Traders (COT) report again showed insignificant changes. During the week, the non-commercial group opened 2,600 long positions and closed 600 shorts. Thus, the net position of non-commercial traders increased by 3,200. But what does it matter if the mood of the big players still remains "pronounced bearish", which is clearly seen in the second indicator in the chart above? To be fair, in recent months, the net position of the non-commercial group is still growing and the pound also shows some tendency to rise. However, both the growth of the net position and the pound are now very weak (in global terms), so it is still difficult to conclude that this is the beginning of a new upward trend, and the pound will no longer fall. We also said that the COT reports do not take into account the demand for the dollar, which is likely to remain very high right now. Therefore, in order to strengthen the British currency, the demand for it should grow faster and stronger than the demand for the dollar. The non-commercial group currently has a total of 89,000 shorts open and only 34,000 longs. The net position will have to show growth for a long time to at least equalize these figures. The Bank of England could provide theoretical support to the pound, as well as the technical need to be corrected from time to time. There is nothing more for the pound to count on now.
We recommend to familiarize yourself with:
Overview of the EUR/USD pair. August 3. And, in fact, why was there such a fuss around Nancy Pelosi's visit to Taiwan?
Overview of the GBP/USD pair. August 3. Pound, calm down! The British currency continues to grow before the Bank of England meeting.
Forecast and trading signals for EUR/USD on August 3. Detailed analysis of the movement of the pair and trading transactions.
GBP/USD 1H
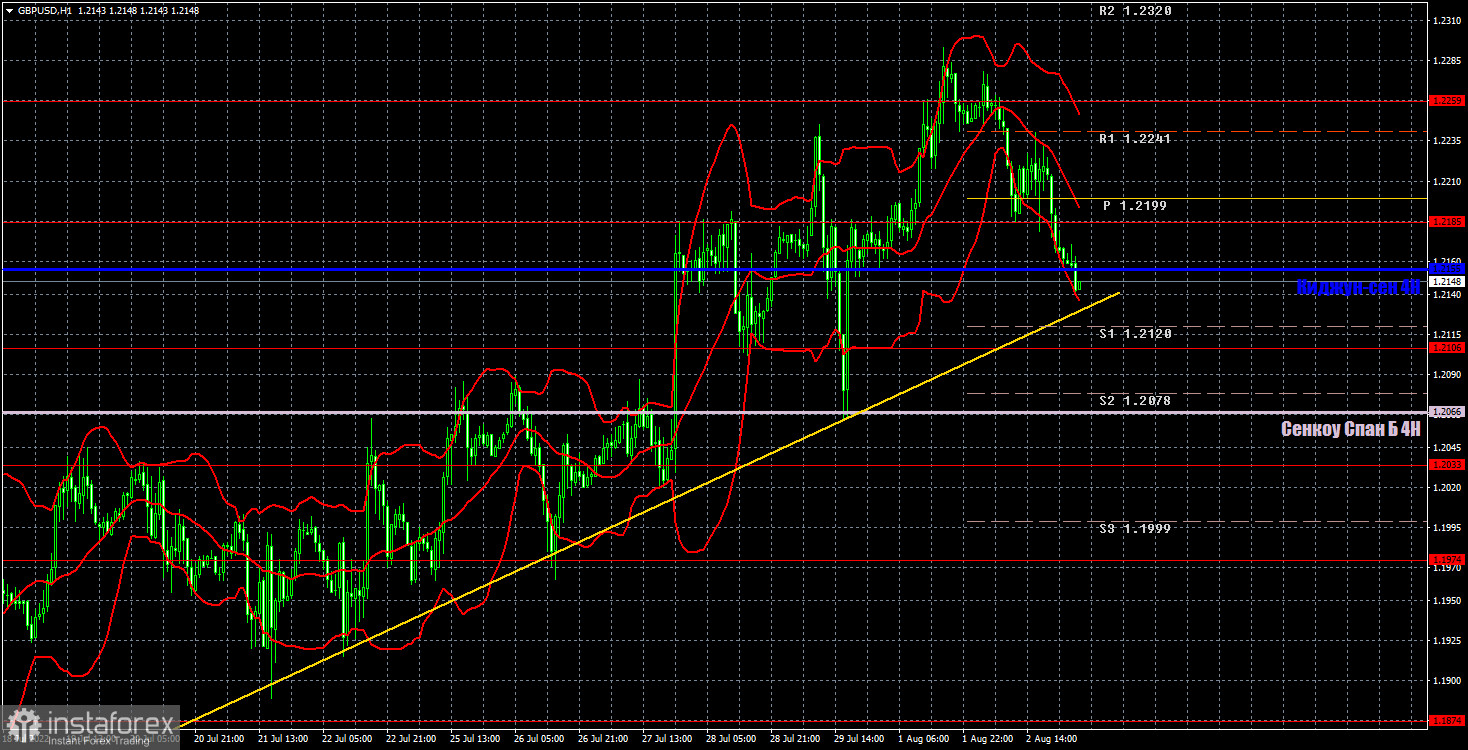
The pair maintains an upward trend on the hourly timeframe, but is currently being corrected. We once again warn that the closer the Bank of England meeting is, the higher the likelihood that the fall of the British currency will begin. A trend change can be identified by price consolidating below the trend line. The pound has already more than worked out the future rate hike. We highlight the following important levels for August 3: 1.1974, 1.2033, 1.2106, 1.2185, 1.2259, 1.2342, 1.2429. Senkou Span B (1.2066) and Kijun-sen (1.2153) lines can also be sources of signals. Signals can be "rebounds" and "breakthroughs" of these levels and lines. The Stop Loss level is recommended to be set to breakeven when the price passes in the right direction by 20 points. Ichimoku indicator lines can move during the day, which should be taken into account when determining trading signals. The chart also contains support and resistance levels that can be used to take profits on trades. Only the indexes of business activity in the services sectors are scheduled for release in the UK in the US on Wednesday, which are unlikely to impress traders so much that we will see their reaction to what is happening. Geopolitics and the upcoming BoE meeting are much more important now.
Explanations for the chart:
Support and Resistance Levels are the levels that serve as targets when buying or selling the pair. You can place Take Profit near these levels.
Kijun-sen and Senkou Span B lines are lines of the Ichimoku indicator transferred to the hourly timeframe from the 4-hour one.
Support and resistance areas are areas from which the price has repeatedly rebounded off.
Yellow lines are trend lines, trend channels and any other technical patterns.
Indicator 1 on the COT charts is the size of the net position of each category of traders.
Indicator 2 on the COT charts is the size of the net position for the non-commercial group.


