


Analysis of Wednesday's deals:
30M chart of the EUR/USD pair
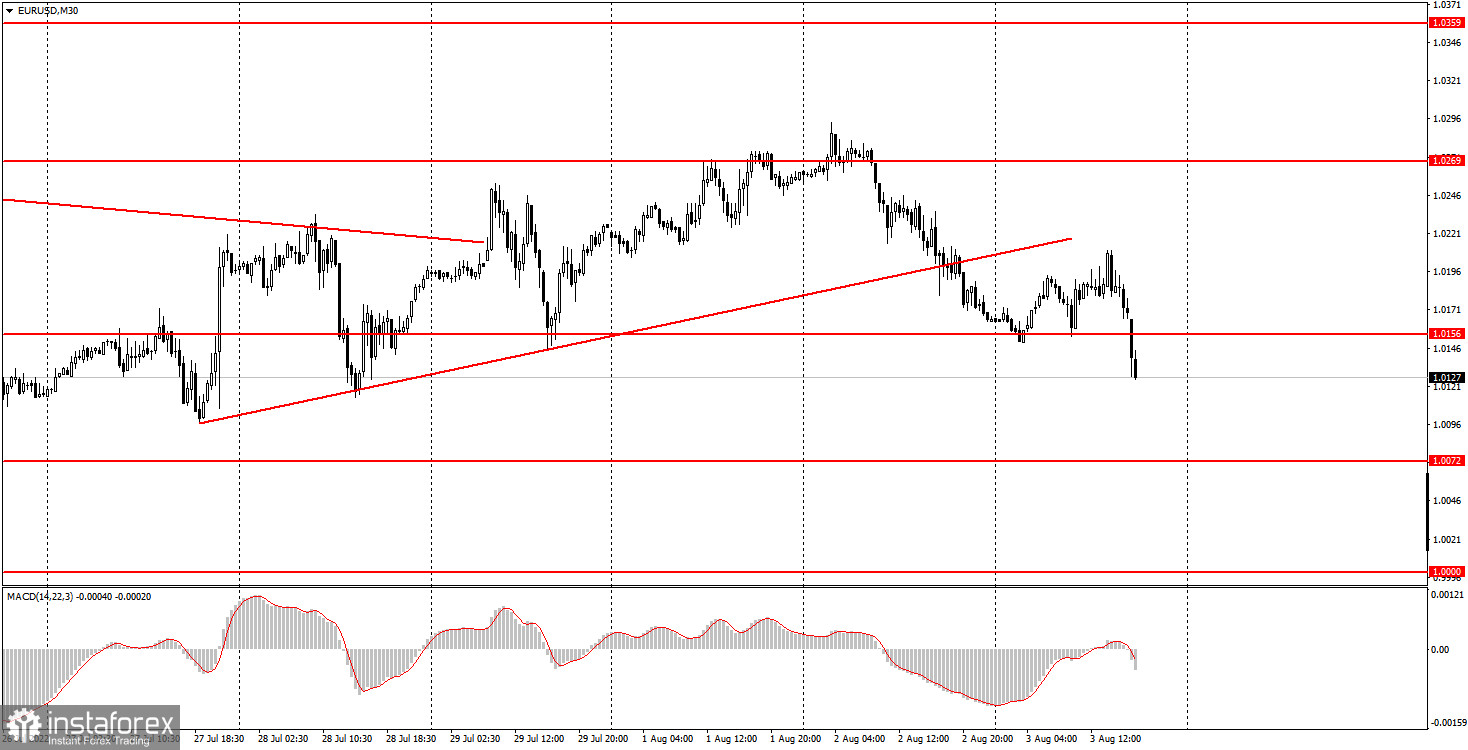
The EUR/USD currency pair on Wednesday, after a short pause, resumed its downward movement. It should be immediately noted that last night the pair's quotes overcame the ascending trend line, which the tongue did not dare to call "strong". In general, the whole movement of the previous weeks looked more like a flat than a trend. Therefore, the bears easily broke the upward trend. Basically, in recent weeks we have repeatedly said that we expect a resumption of the long-term downward trend. Why shouldn't it start right now? The geopolitical situation in the world continues to deteriorate, the fundamental background remains unchanged - the best platform for the dollar's growth. Only minor indicators were published in the European Union and the United States. Namely, indexes of business activity in the services sector. In the European Union, the index value was 51.2 points, and in the US - 56.7. Moreover, take note that it was the US index that turned out to be much stronger than the forecast (52.5-53.5). Thus, the dollar's growth in the afternoon could be partly triggered by this report. We have repeatedly said that the market may react to such reports in case of a strong deviation of the forecasted value from the actual one. As a result, we have a new downward trend.
5M chart of the EUR/USD pair
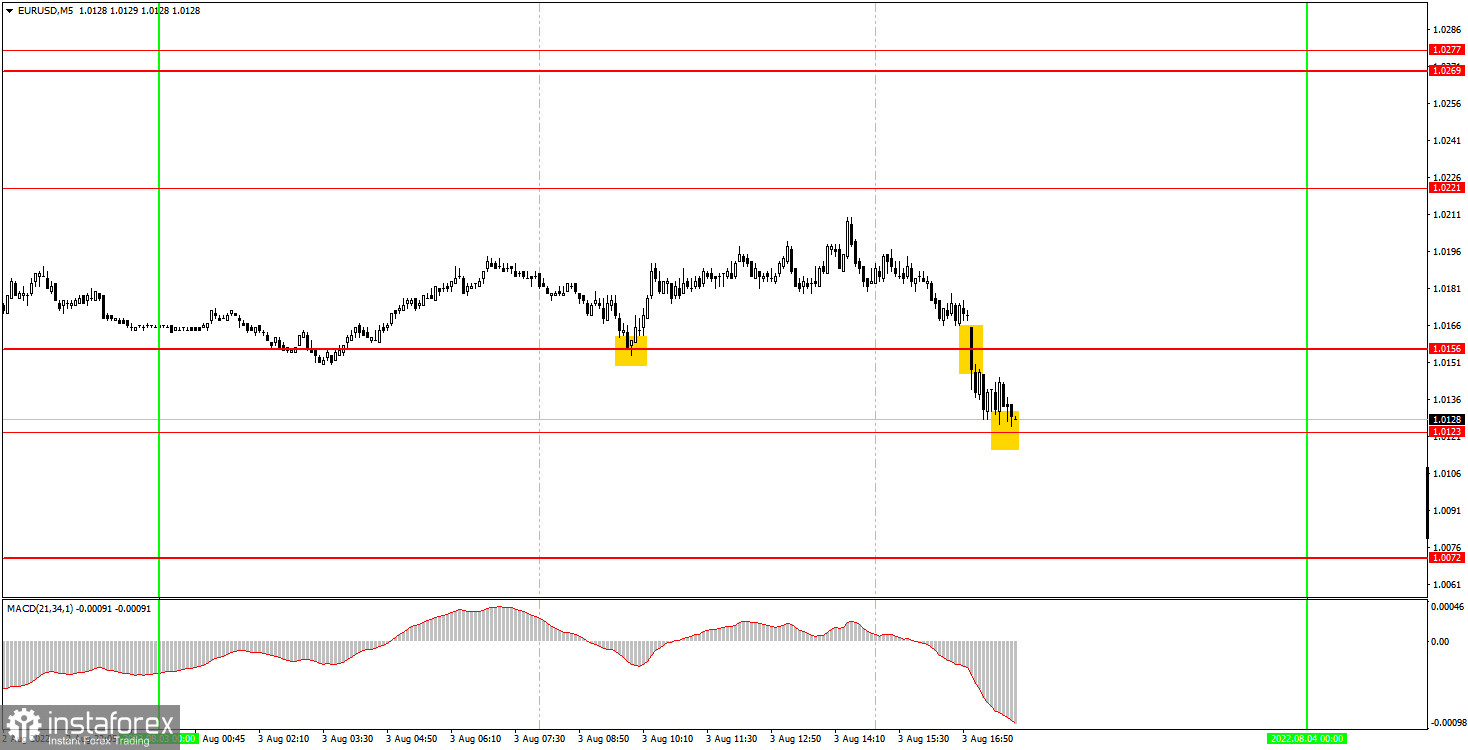
All movements on the 5-minute timeframe do not look so impressive. The pair has been trying to maintain an upward trend for most of Wednesday and gravitated towards growth. However, during the US trading session (even before the release of business activity indexes), the strengthening of the US dollar began, which broke the whole technical picture. There were few trading signals during the day. There was a rebound from the level of 1.0156 in the morning, after which the pair went up 43 points, but failed to reach the target level of 1.0221. Therefore, the long position was closed by Stop Loss at breakeven. This was followed by a signal to sell, when the price settled below the level of 1.0156 and in an hour the pair was already near the level of 1.0123, where it was possible to take profit on this deal. It was small, only about 20 points, but still it's better than nothing. In general, we also note that the pair remains inside the horizontal channel, which is clearly visible on higher timeframes, so the US currency's succeeding growth is also not obvious yet. Nevertheless, most of the factors continue to signal precisely the fall of the EUR/USD pair in the medium term.
How to trade on Thursday:
The upward trend on the 30-minute timeframe has been canceled at this time, and a new downward trend has formed instead, which intersects with the flat. Therefore, there are much more chances for the pair to fall now, but if the price fails to go below the level of 1.0130, then the downward trend can be canceled as quickly as the upward trend. On the 5-minute TF on Thursday, it is recommended to trade at the levels of 1.0000, 1.0072, 1.0123, 1.0156, 1.0221, 1.0269-1.0277. When passing 15 points in the right direction, you should set Stop Loss to breakeven. No important reports scheduled in the US and the EU for Thursday. Thus, the market will be able to react only to geopolitical events. And if the situation in the world continues to worsen and escalate, then it is likely to see a new growth from the dollar.
Basic rules of the trading system:
1) The signal strength is calculated by the time it took to form the signal (bounce or overcome the level). The less time it took, the stronger the signal.
2) If two or more deals were opened near a certain level based on false signals (which did not trigger Take Profit or the nearest target level), then all subsequent signals from this level should be ignored.
3) In a flat, any pair can form a lot of false signals or not form them at all. But in any case, at the first signs of a flat, it is better to stop trading.
4) Trade deals are opened in the time period between the beginning of the European session and until the middle of the US one, when all deals must be closed manually.
5) On the 30-minute TF, using signals from the MACD indicator, you can trade only if there is good volatility and a trend, which is confirmed by a trend line or a trend channel.
6) If two levels are located too close to each other (from 5 to 15 points), then they should be considered as an area of support or resistance.
On the chart:
Support and Resistance Levels are the Levels that serve as targets when buying or selling the pair. You can place Take Profit near these levels.
Red lines are the channels or trend lines that display the current trend and show in which direction it is better to trade now.
The MACD indicator (14,22,3) consists of a histogram and a signal line. When they cross, this is a signal to enter the market. It is recommended to use this indicator in combination with trend lines (channels and trend lines).
Important speeches and reports (always contained in the news calendar) can greatly influence the movement of a currency pair. Therefore, during their exit, it is recommended to trade as carefully as possible or exit the market in order to avoid a sharp price reversal against the previous movement.
Beginners on Forex should remember that not every single trade has to be profitable. The development of a clear strategy and money management are the key to success in trading over a long period of time.


