


Analysis of Wednesday's deals:
30M chart of the GBP/USD pair
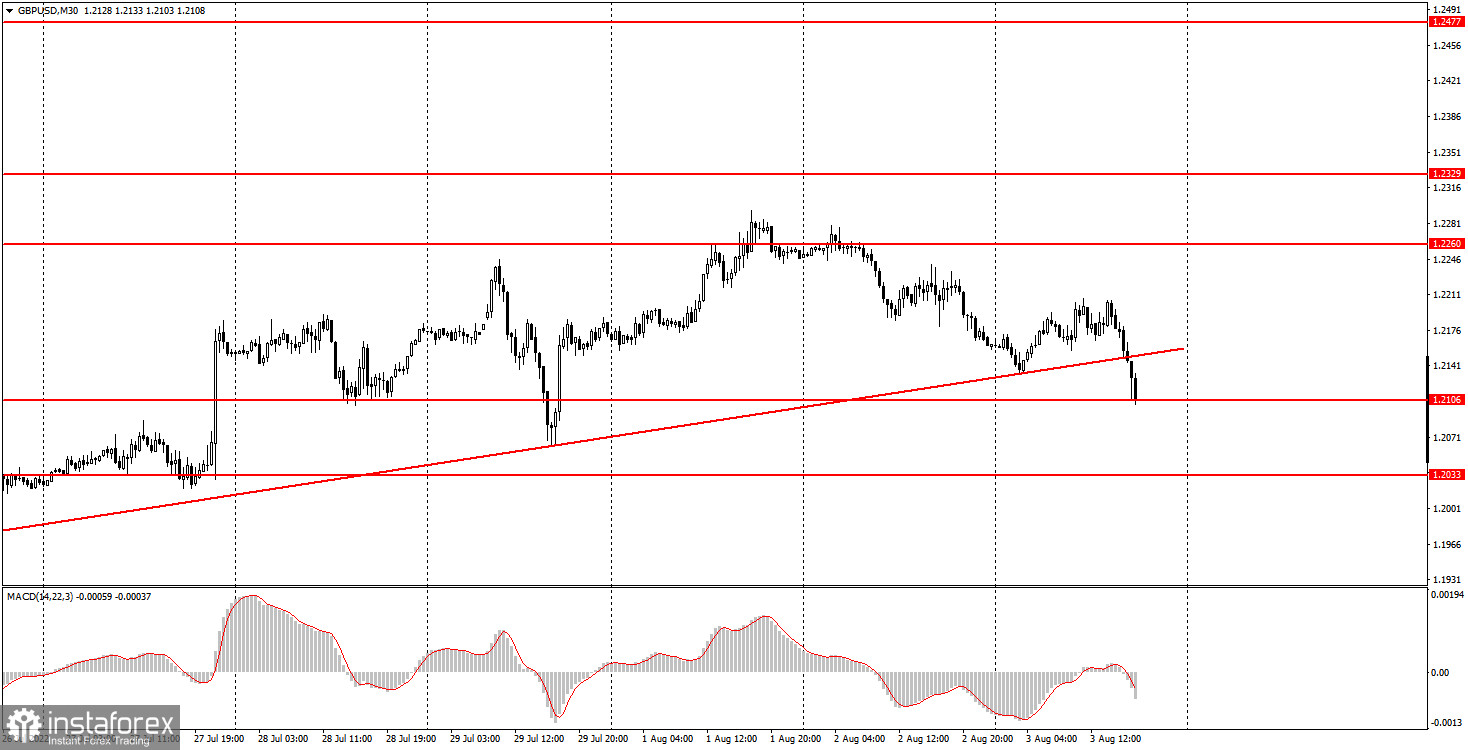
The GBP/USD pair consolidated below the rising trend line on Wednesday and this signal is already really serious. The fact is that, unlike the trend line for the euro/dollar pair, the trend line for the pound remained relevant for more than three weeks. That is, it is strong. And consolidating below it indicates a high probability of completion of the growth of the British currency, at least for the next few weeks. As a result, we have a situation in which both pairs have settled below the trend lines, so both now have excellent chances of continuing to fall. It should also be noted that the pound (like the euro) is a risky currency, therefore, in the event of a deterioration in the geopolitical situation in the world, it is prone to fall. And now, for sure, geopolitics is deteriorating and one can only hope that everything does not end in another conflict. Also, the Bank of England will announce the results of the meeting on Thursday, which the market had the opportunity to work out many times already. Therefore, we believe that even a rate hike from the BoE will provoke a fall in the pound, rather than its growth. Like it or not, we'll find out on Thursday, but the breakdown of the upward trend just a day before an important fundamental event says a lot.
5M chart of the GBP/USD pair
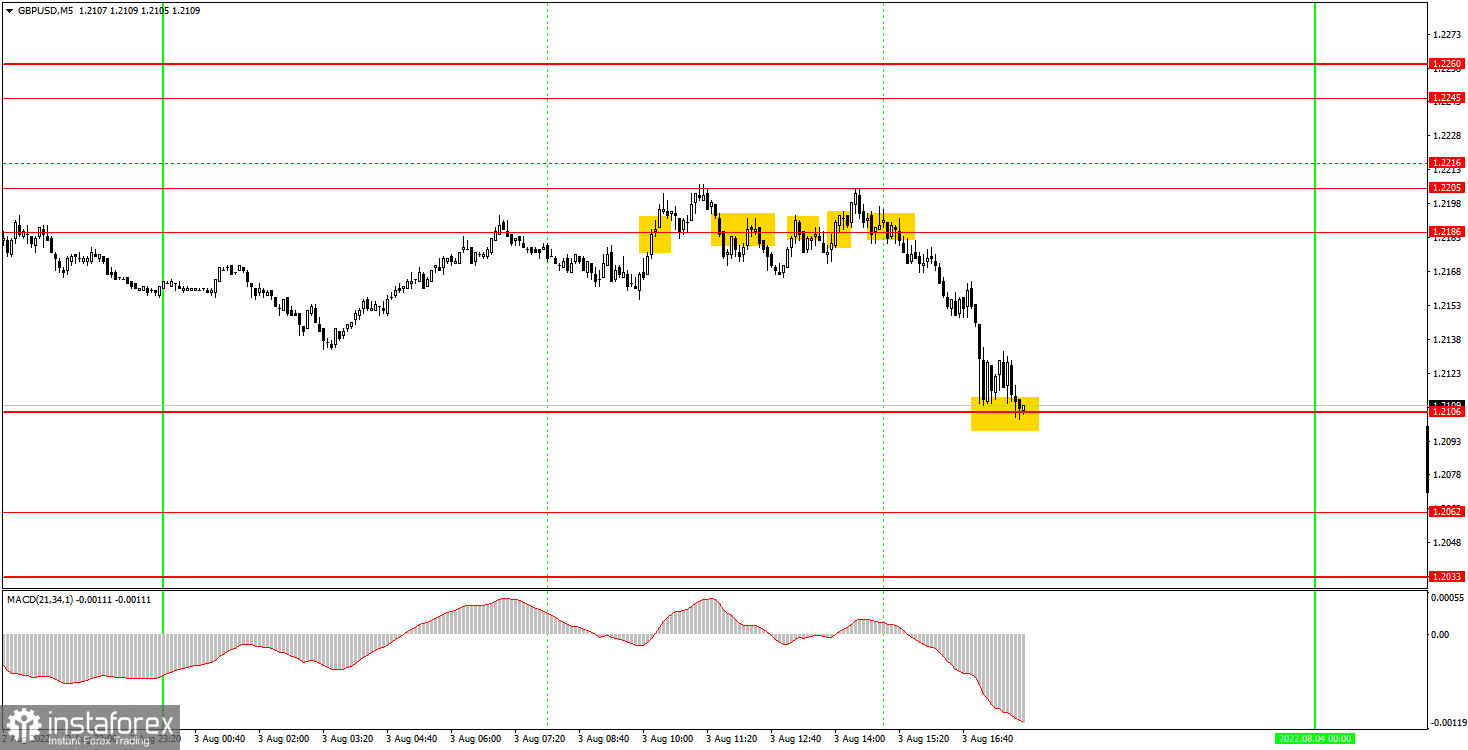
It is clearly seen on the 5-minute timeframe that the pound/dollar pair has been trying to continue the upward movement for most of the day. However, like the euro/dollar, it failed. Unfortunately, there was no clear sell signal, so novice traders most likely missed the main move. The problem was that the pair was trading almost flat during the European trading session and broke the 1.2186 level many times, each time forming a false signal. Immediately, we note: the level of 1.2205 is a new level (Wednesday's high), the level of 1.2216 is recognized as irrelevant. Thus, beginners could try to work out the first two signals around the level of 1.2186 today. In both cases, the price could not move even 20 points in the right direction, so it was not possible to place Stop Loss on these trades. The result was a small loss. And when the price nevertheless started a strong, trending movement and a sell signal was formed, it should no longer be worked out, since before that four false signals had been formed near the level of 1.2186. As a result, the day turned out to be very unsuccessful, but, on the other hand, every day cannot be successful and profitable.
How to trade on Thursday:
The pound/dollar pair has overcome the trend line on the 30-minute TF, so the upward trend has been canceled. We are now expecting another serious fall in the pound, which may last at least a few weeks. However, Thursday's results of the BoE meeting can also leave a huge imprint on the chart of the currency pair's movement. It would be best to sum up and draw conclusions on Friday. On the 5-minute TF on Thursday, it is recommended to trade at the levels of 1.1967, 1.2033, 1.2062, 1.2106, 1.2186, 1.2205, 1.2245-1.2260. When the price passes after opening a deal in the right direction for 20 points, Stop Loss should be set to breakeven. No important events scheduled for Thursday in the US, while the results of the BoE meeting will be summed up in the UK tomorrow. Thus, we are in for a very volatile day.
Basic rules of the trading system:
1) The signal strength is calculated by the time it took to form the signal (bounce or overcome the level). The less time it took, the stronger the signal.
2) If two or more deals were opened near a certain level based on false signals (which did not trigger Take Profit or the nearest target level), then all subsequent signals from this level should be ignored.
3) In a flat, any pair can form a lot of false signals or not form them at all. But in any case, at the first signs of a flat, it is better to stop trading.
4) Trade deals are opened in the time period between the beginning of the European session and until the middle of the US one, when all deals must be closed manually.
5) On the 30-minute TF, using signals from the MACD indicator, you can trade only if there is good volatility and a trend, which is confirmed by a trend line or a trend channel.
6) If two levels are located too close to each other (from 5 to 15 points), then they should be considered as an area of support or resistance.
On the chart:
Support and Resistance Levels are the Levels that serve as targets when buying or selling the pair. You can place Take Profit near these levels.
Red lines are the channels or trend lines that display the current trend and show in which direction it is better to trade now.
The MACD indicator (14,22,3) consists of a histogram and a signal line. When they cross, this is a signal to enter the market. It is recommended to use this indicator in combination with trend lines (channels and trend lines).
Important speeches and reports (always contained in the news calendar) can greatly influence the movement of a currency pair. Therefore, during their exit, it is recommended to trade as carefully as possible or exit the market in order to avoid a sharp price reversal against the previous movement.
Beginners on Forex should remember that not every single trade has to be profitable. The development of a clear strategy and money management are the key to success in trading over a long period of time.


