


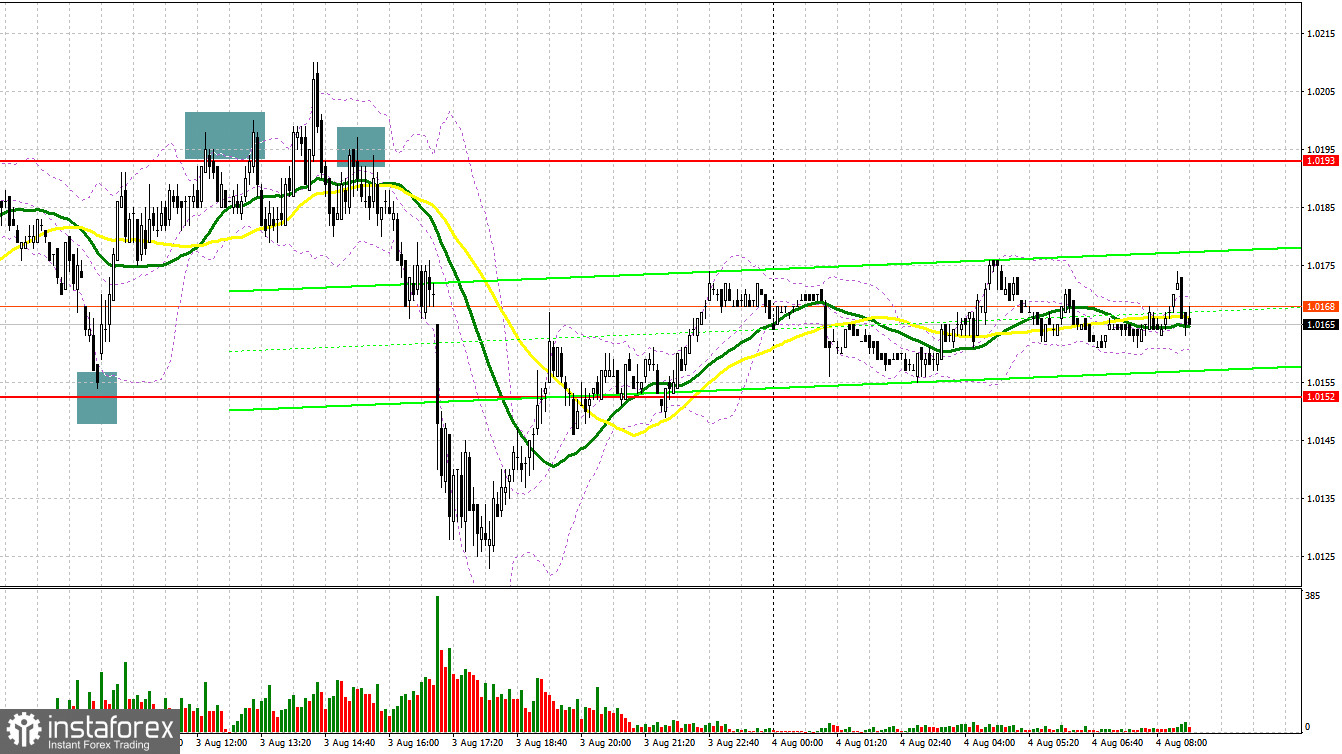
Yesterday, traders received several signals to enter the market. Let us focus on the 5-minute chart to figure out what happened. Earlier, I asked you to pay attention to the level of 1.0152 to decide when to enter the market. Since the euro dropped to 1.0152, a false breakout was formed. As a result, traders received a buy signal, expecting a correction to higher levels. Strong data from the eurozone supported the pair, allowing it to return to 1.0193. However, the pair failed to break above this level. A false breakout of the level gave a sell signal, but the euro did not show a fast drop. In the second part of the day, the euro failed to consolidate above 1.0193. A false breakout of this level, a sell signal as well as positive data from ISM led a slump in the euro, allowing traders to earn about 70 pips.
Conditions for opening long positions on EUR/USD:
Today, there will be no report that will be able to support the euro. That is why a lot will depend on the BoE's decision. However, traders should still pay attention to Germany's industrial orders and ECB Economic Bulletin. New forecasts may bring the ECB's plans to the light, whereas the bulletin will help traders understand the current economic condition. Notably, the economy expanded in the second quarter, surprising most traders. Although the predictions are quite positive, I think that the pair will continue losing value. A false breakout of 1.0152 will give the first long signal with the target at the resistance level of 1.0193. Slightly below this level, there are bearish moving averages. A breakout and a downward test of this level may affect bears' stop orders, giving an additional buy signal with the target at 1.0233. The next target is located at 1.0278, where it is recommended to lock in profits. If the euro/dollar pair declines and buyers fail to protect 1.0152, pressure on the pair will rise, allowing it to slide to the lower limit of the range of 1.0115. It will be better to go long after a false breakout of this level. It is also possible to buy the euro/dollar pair after a bounce off 1.0082 or lower – from 1.0445, expecting an upward correction of 30-35 pips.
Conditions for opening short positions on EUR/USD:
Yesterday, the euro slumped after the publication of the US statistical data. Today, bears are likely to push the price to the lower limit of the range located at 1.0115. This will become possible in case of weak data from the eurozone and increasing conflict between the US and China. It will be good to sell the asset after a false breakout of the nearest resistance level of 1.0193. This will form a sell signal, thus pushing the price to 1.1052. A breakout and settlement below this area as well as an upward test will give an additional sell signal that will affect buyers' stop orders. As a result, the pair may tumble to 1.0115. If the price settles below this level, it will surely slide to 1.0082, where traders are better to leave the market. The next target is located at 1.0045, but the pair will be able to touch it only in case of very strong data from the US. If the euro/dollar pair increases during the European session and bears fail to protect 1.0193, traders should avoid short orders until the price hits 1.0233. A false breakout of this level will allow sellers to return to the market. It will be possible to sell from 1.0278 or higher – from 1.0323, expecting a decline of 30-35 pips.
COT report
According to the COT report from July 26, the number of both long and short positions increased. However, the number of long ones turned out to be bigger, reflecting an gradual end of the bear market and an attempt to find the bottom after reaching the parity level. The euro advanced amid economic reports from the EU released last week. A slight acceleration in inflation was eclipsed by a sharp growth of the European economy in the second quarter of this year. GDP rose by 4.0 on a yearly basis, surprising economists. It also facilitated the bullish sentiment after the Fed hinted at a possible slowdown in monetary tightening. To this end, the EUR/USD pair is likely to approach new highs. The COT report revealed that the number of long non-commercial positions increased by 2,166 to 198,041, while the number of short non-commercial positions jumped by 1,005 to 239,625. At the end of the week, the total non-commercial net position remained negative. Yet, it rose slightly to -41,584 from -42,745. The weekly closing price dropped to 1.0161 from 1.0278.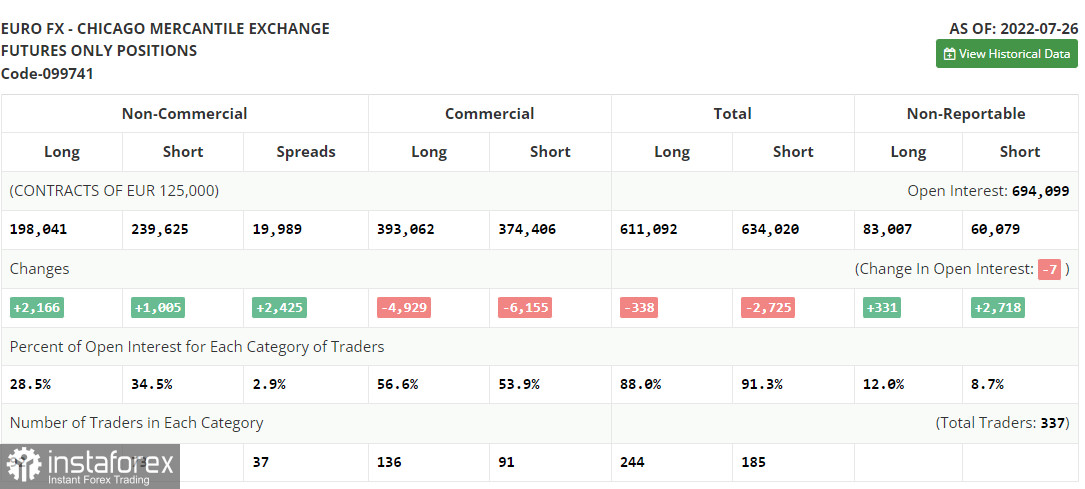
Signals of indicators:
Moving Averages
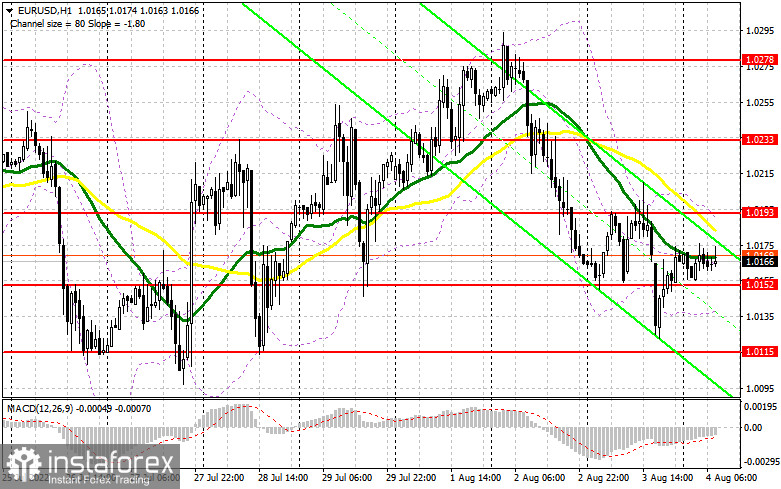
Trading is performed below 30- and 50-day moving averages, which points to the continuation of the downward correction.
Note: The period and prices of moving averages are considered by the author on the one-hour chart that differs from the general definition of the classic daily moving averages on the daily chart.
Bollinger Bands
If the pair declines, the lower limit of the indicator located at 1.0135 will act as support. In case of a rise, the resistance level will be located at 1.0190.
Description of indicators- Moving average (moving average, determines the current trend by smoothing volatility and noise). The period is 50. It is marked in yellow on the chart.
- Moving average (moving average, determines the current trend by smoothing volatility and noise). The period is 30. It is marked in green on the graph.
- MACD indicator (Moving Average Convergence/Divergence - convergence/divergence of moving averages). A fast EMA period is 12. A slow EMA period is 26. The SMA period is 9.
- Bollinger Bands. The period is 20.
- Non-profit speculative traders are individual traders, hedge funds, and large institutions that use the futures market for speculative purposes and meet certain requirements.
- Long non-commercial positions are a total number of long positions opened by non-commercial traders.
- Short non-commercial positions are a total number of short positions opened by non-commercial traders.
- The total non-commercial net position is a difference in the number of short and long positions opened by non-commercial traders.


