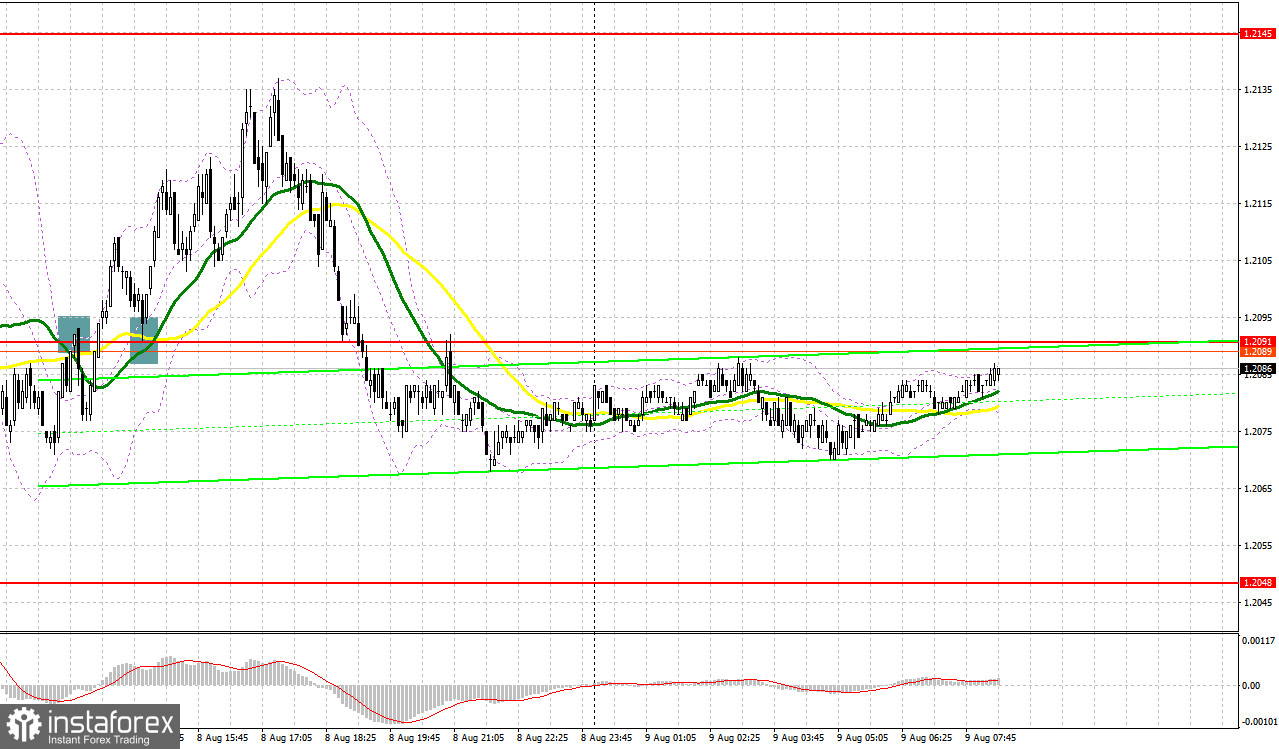
Yesterday, traders received several signals to enter the market. Let us take a look at the 5-minute chart to clear up the market situation. Earlier, I asked you to pay attention to the level of 1.2091 to decide when to enter the market. The first attempt of buyers to consolidate above 1.2091 led to failure. However, later, they managed to do so. A downward test of this level gave a buy signal, boosting the price by 45 pips. Notably, the pair did not hit the expected level of 1.2145. As a result, we did not receive a buy signal from this level.

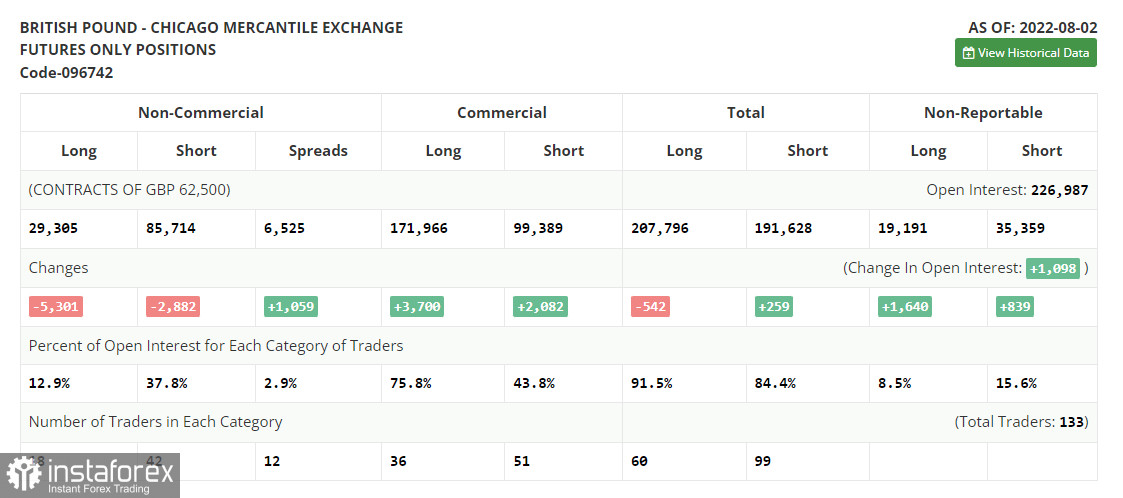
Before we focus on a technical picture, let us take a look at the futures market. According to the COT report from August 2, the number of both short and long positions declined. However, the number of long positions showed a more significant drop, reflecting traders' concern about the current economic situation in the UK and BoE's aggressive policy. Last week, the regulator raised the benchmark rate by 0.5 basis points. This was the sharpest rise in the last 27 years. It is obvious that the central bank is ready to affect the economic growth pace, which is rapidly dropping, to cope with the record high inflation. By October of this year, inflation may reach 13.0%, according to official forecasts. Even under the current conditions, traders of the pound sterling should not lose hope since the currency is greatly oversold against the US dollar. If in the near future, the US inflation data surprises investors, the pound/dollar pair may resume rising. The COT report unveiled that the number of long non-commercial positions decreased by 5,301 to 29,305, while the number of short non-commercial positions slid by 2,882 to 85,714, which led to an increase in the negative value of the non-commercial net position to the level of -56,409 from -53,990. The weekly closing price rose to 1.2180 against 1.2043.

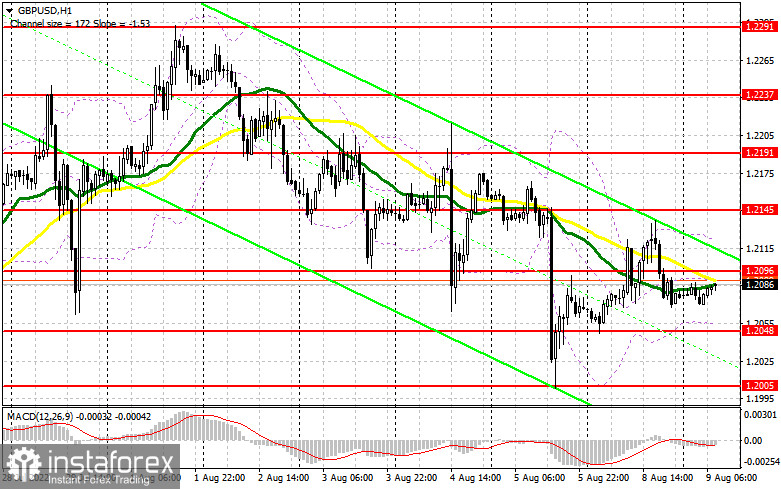
Today, the UK macroeconomic calendar is empty again. This will provide buyers of the pound sterling with a chance for a further rise against the greenback. However, most traders will focus on the US inflation report that will be published tomorrow. That is why the pair will hardly move only in one direction. It may repeat yesterday's scenario. If the pair declines in the first part of the day, it will be better to wait for a false breakout near the closest support level of 1.2048, which the pair did not hit yesterday. In this case, the price may jump to 1.2096. If it climbs above this level, traders will receive signals about a possible upward correction. A breakout of 1.2096 may allow the price to climb to the high of 1.2145. Yesterday, the pound sterling showed a noticeable decline from this level. The next target is located at 1.2191, where it is recommended to lock in profits. If the pound/dollar pair decreases and buyers fail to protect 1.2048, pressure on the pound sterling will increase, thus forcing bulls to leave the market until the publication of the US data. If it happens, it will be better to avoid long orders until the price hits 1.2005, a strong support level formed on Friday. It is better to buy from this level only after a false breakout.Traders may go long just after a bounce off 1.1964 or lower – from 1.1929, expecting a correction of 30-35 pips.
Conditions for opening short positions on GBP/USD:
Today, sellers should primarily protect the nearest resistance level of 1.2096. Otherwise, the short-term downward movement will become impossible. That is why a false breakout of 1.2096 may put the pound sterling under pressure again, forming a sell signal with the target at the support level of 1.2048. Since the macroeconomic calendar is empty today, the pair will hardly decline below the mentioned level. That is why only a breakout and an upward test of 1.2048 will give a sell signal with the target at 1.2005. The next target is located at 1.1964, where it is recommended to lock in profits. If the pound/dollar pair increases and bears fail to protect 1.2096, buyers will have a chance to return to 1.2145. Only a false break of this level will give a sell signal. Otherwise, the price may jump to the high of 1.2211. There traders should sell just after a rebound, expecting a drop of 30-35 pips within the day.

Signals of indicators:
Moving Averages
Trading is performed below 30- and 50-day moving averages, thus providing sellers with a chance for a further decline.
Note: The period and prices of moving averages are considered by the author on the one-hour chart that differs from the general definition of the classic daily moving averages on the daily chart.
Bollinger Bands
A breakout of the lower limit of the indicator located at 1.2055 will intensify pressure on the pair. In case of a rise, the upper limit of the indicator located at 1.2125 will act as resistance.
Description of indicators- Moving average (moving average, determines the current trend by smoothing volatility and noise). The period is 50. It is marked in yellow on the chart.
- Moving average (moving average, determines the current trend by smoothing volatility and noise). The period is 30. It is marked in green on the graph.
- MACD indicator (Moving Average Convergence/Divergence - convergence/divergence of moving averages). A fast EMA period is 12. A slow EMA period is 26. The SMA period is 9.
- Bollinger Bands. The period is 20.
- Non-profit speculative traders are individual traders, hedge funds, and large institutions that use the futures market for speculative purposes and meet certain requirements.
- Long non-commercial positions are a total number of long positions opened by non-commercial traders.
- Short non-commercial positions are a total number of short positions opened by non-commercial traders.
- The total non-commercial net position is a difference in the number of short and long positions opened by non-commercial traders.


