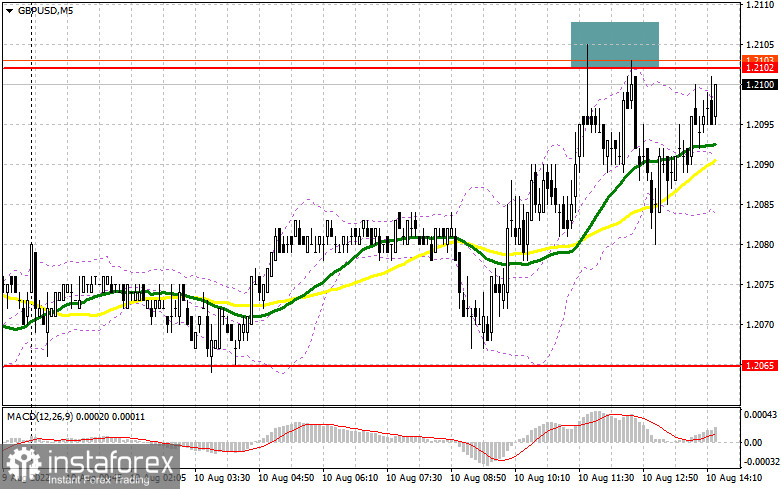
In my forecast this morning, I drew your attention to the level of 1.2102 and recommended entering the market from it. Let's have a look at the 5-minute chart and analyze the situation. As a result of the growth of the pair in the morning, several false breakouts near 1.2102 created sell signals for the pound, but as you can see on the chart, there was no major downside movement. The pair managed to increase by 20 pips only. In the second half of the day, the technical picture slightly changed.

Long positions on GBP/USD:
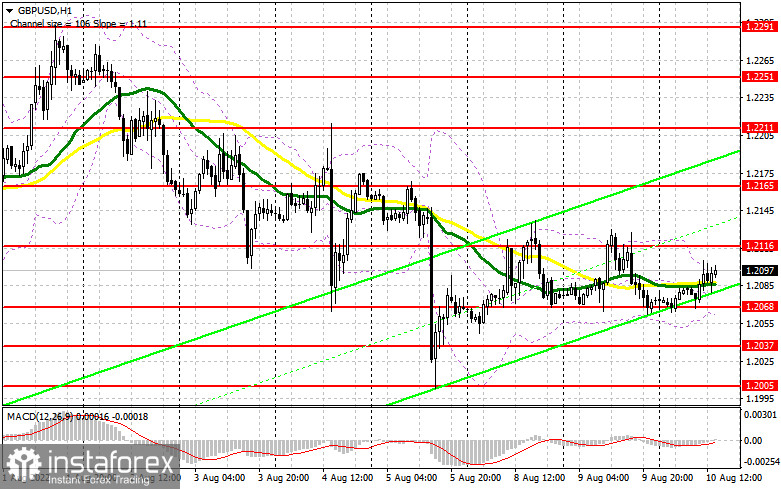
Much depends on how the market would digest the highly expected US inflation data. In my opinion, whatever the report is, it is unlikely to change the plans of the GBP buyers. Even if the prices show some growth in July in the US, the GBP/USD pair is likely to decline only slightly and the price can recover very quickly. A false breakout near 1.2068 may give an excellent signal to buy the pound as a continuation of the July bullish scenario. If we see inflation slowing down, there will be no more reasons to buy the US dollar as a safe-haven asset. A breakthrough of the resistance at 1.2116 and a reverse bottom/top test may open the way to 1.2165. The next target is located at the high of 1.2211, where traders may lock in profits. If the GBP/USD pair falls and bulls show weak activity at 1.2068, pressure on the pound may increase considerably, forcing bulls to take profits because of the risk of another major drop of the pair to continue the bearish scenario, observed since early August. If that happens, it would be better to postpone opening long positions until the pair reaches 1.2037, where I would recommend buying the pound after a false breakout. It is possible to open long positions in GBP/USD on a rebound from 1.2005 or lower near 1.1964, allowing an intraday correction of 30-35 pips.
Short positions on GBP/USD:
Bears continue to resist sellers' attacks, taking advantage of the news. The Fed warned that the situation in the economy may become more complicated in case of another sign of rising prices. The best scenario to open short positions is a new inflationary high in the US and a false breakout near 1.2116, which is likely to put pressure on the pound and drag it to the support at 1.2068. The bears need to close below that level if they want to keep the pressure on the pound. A breakthrough and a reverse bottom/top test of 1.2068 may create an entry point into short positions with the target at 1.2037. The next target is located in the area of 1.2005, where traders may take profits. If the GBP/USD pair grows and bears show a lack of activity at 1.2116, bulls will have a chance to change the situation in their favor and form a new ascending correctional channel. In that case, I would not rush to sell the pound. Only a false breakout at 1.2165 may create an entry point into short positions, counting on a downside rebound of the pair. If bears show no activity at that level, the price may climb to the high of 1.2211. Short positions from 1.2211 may be opened on a rebound bounce, allowing a downward intraday correction of 30-35 pips.

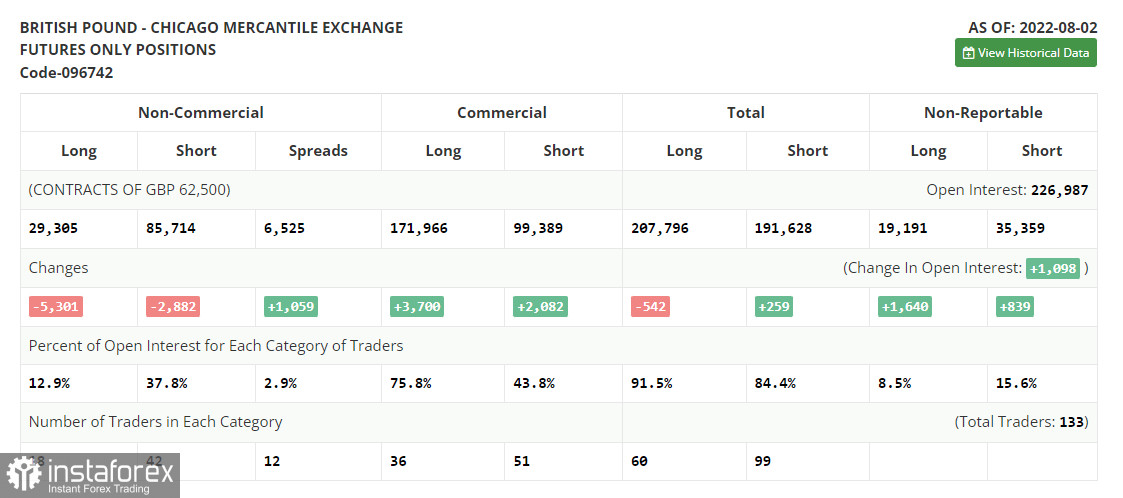
The COT report for August 2 logged a decrease in both short and long positions but the decline of the latter was greater, which led to an increase in the negative delta. This suggests that many traders continue to be wary of what is now happening to the British economy and what the aggressive policy of the Bank of England may lead to. Last week, the regulator raised interest rates by 0.5 points at once, the most significant policy change in 27 years. It is obvious that the central bank is ready to sacrifice the rate of economic growth, which is inexorably shrinking, in order to still cope with the record level of inflation, which by October of this year may reach 13.0%, according to official forecasts. Even in such circumstances, we should not lose faith in the British pound, which is rather oversold against the US dollar. If the US inflation data surprises investors, it is quite possible that the GBP/USD pair may resume its rally. The COT report showed that long non-commercial positions declined by 5,301 to 29,305, while short non-commercials declined by 2,882 to 85,714, which raised the negative non-commercial net position to -56,409 from -53,990. The weekly closing price rose to 1.2180 against 1.2043.

Indicator signals:
Moving averages
The pair is trading near the 30- and 50-day moving averages, indicating the market is in a state of uncertainty.
Note: Period and prices of moving averages are considered by the author on hourly chart H1 and differ from the common definition of classic daily moving averages on daily chart D1.
Bollinger Bands
In the case of a decline, the lower boundary of the indicator near 1.2055 will act as support.
Indicator descriptions
- Moving average defines the current trend by smoothing out volatility and market noise. Period 50. Marked in yellow on the chart.
- Moving average defines the current trend by smoothing out volatility and market noise. Period 30. Marked in green on the chart.
- MACD (Moving Average Convergence/Divergence) indicator Fast EMA of period 12. Slow EMA period 26. SMA period 9
- Bollinger Bands. Period 20
- Non-commercial traders are speculators, such as individual traders, hedge funds, and large institutions, which use the futures market for speculative purposes and meet certain requirements.
- Long non-commercial positions represent the total long open position of non-commercial traders.
- Short non-commercial positions represent the total short open position of non-commercial traders.
- Total non-commercial net position is the difference between the short and long positions of non-commercial traders.


