


EUR/USD 5M
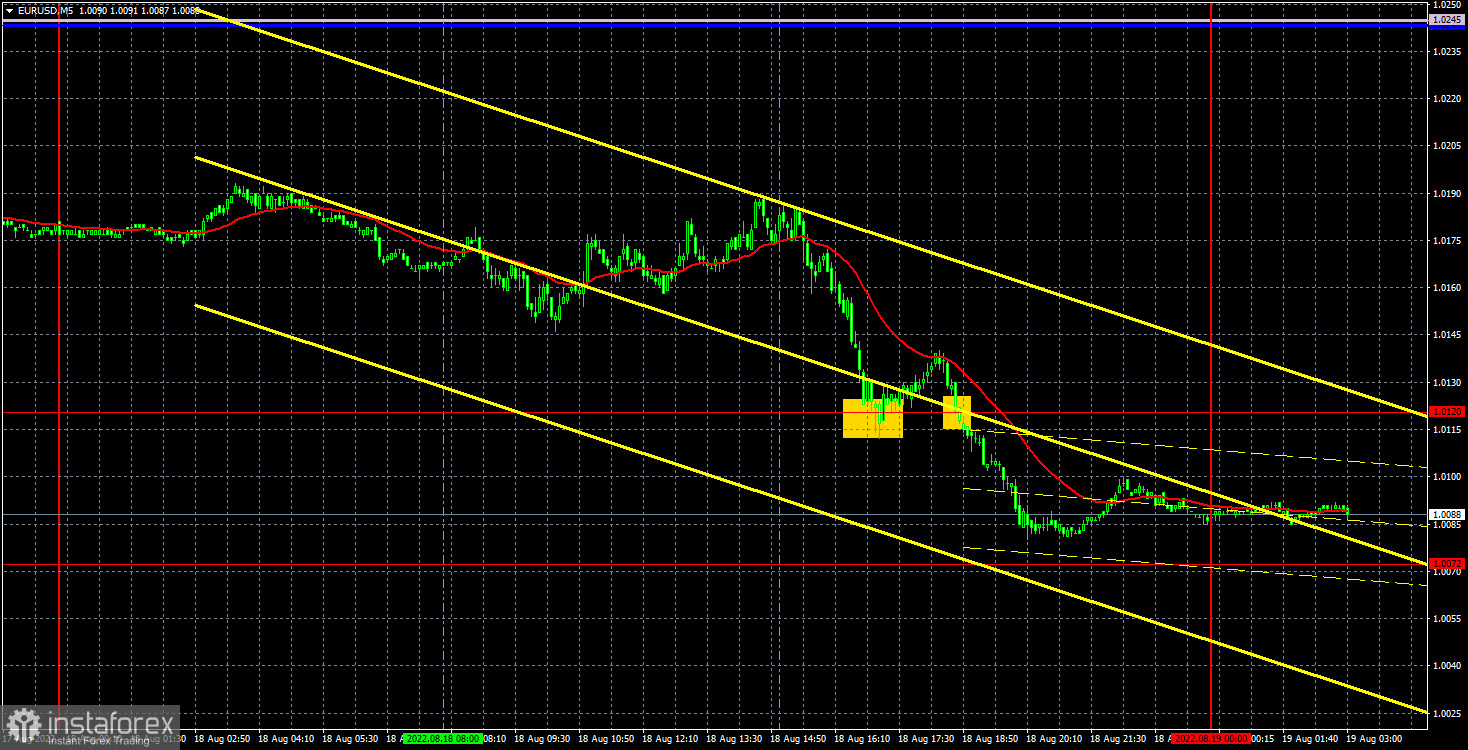
During the fourth trading day of the week, the EUR/USD pair spent most of the day in thought. We have already said many times that the fundamental and geopolitical backgrounds remain on the dollar's side, so in any case we expect the euro to fall further. In principle, now the pair has confidently taken a new update of its 20-year lows. It is noteworthy that there were no important events both in the European Union and the United States that could provoke such a strong fall during the day. The inflation report does not count as it was the second, final assessment for July, and traders clearly knew what value they should expect. And not even during the day, but only during the US trading session. If on the 4-hour timeframe this movement does not look too strong and the pair even retains a high probability of a flat, then on the hourly timeframe it looks very impressive. As we have already said, there was no macroeconomic background yesterday, which did not prevent traders from actively selling the euro. From our point of view, it is these days that best show the true mood of the market. And now it seems to be bearish.
Unfortunately, the situation with the day's trading signals was not easy. The first one was formed in the US session, when most of the way down had already been covered. Moreover, at first the price rebounded from the level of 1.0120, which forced traders to open long positions. The pair could not go up even 15 points, so the deal closed at a loss. The next sell signal was formed in a couple of hours and, as an exception, it could be worked out. It made it possible to cover the loss on the first trade and earn some money. But obviously not as much as we would like on such a strong movement.
COT report:
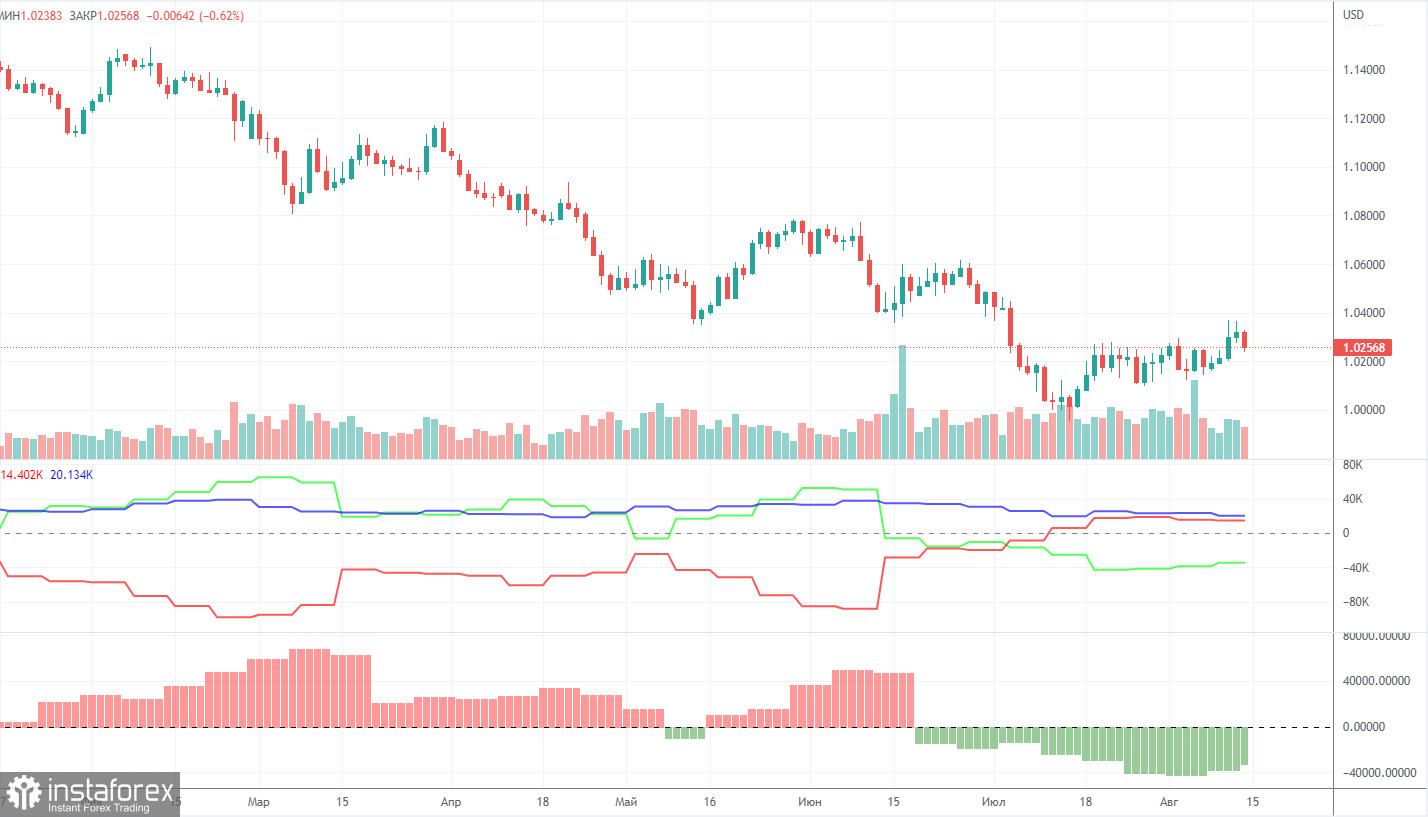
The Commitment of Traders (COT) reports on the euro over the past six months have raised a huge number of questions. The chart above clearly shows that for most of 2022 they showed an openly bullish mood of commercial players, but at the same time, the euro fell steadily at the same time. At this time, the situation has changed, but NOT in favor of the euro. If earlier the mood was bullish, and the euro was falling, now the mood is bearish and... the euro is also falling. Therefore, for the time being, we do not see any grounds for the euro's growth, because the vast majority of factors remain against it. During the reporting week, the number of long positions for the non-commercial group increased by 8,400, and the number of shorts - by 4,100. Accordingly, the net position increased by about 4,000 contracts, which is a negligible change for the euro. The mood of major players remains bearish. From our point of view, this fact very eloquently indicates that at this time even commercial traders still do not believe in the euro. The number of longs is lower than the number of shorts for non-commercial traders by 35,000. Therefore, we can state that not only does the demand for the US dollar remain high, but that the demand for the euro is also quite low. The fact that major players are in no hurry to buy the euro may lead to a new, even greater fall. The euro has not been able to show even a tangible correction over the past six months or a year, not to mention something more. The highest upward movement was about 400 points. The pair has just managed to correct by 400 points over the past four weeks. Has the plan been completed?
We recommend to familiarize yourself with:
Overview of the EUR/USD pair. August 19. Euro on the verge of another flat.
Overview of the GBP/USD pair. August 19. The British pound risks going into a wide horizontal channel.
Forecast and trading signals for GBP/USD on August 19. Detailed analysis of the movement of the pair and trading transactions.
EUR/USD 1H
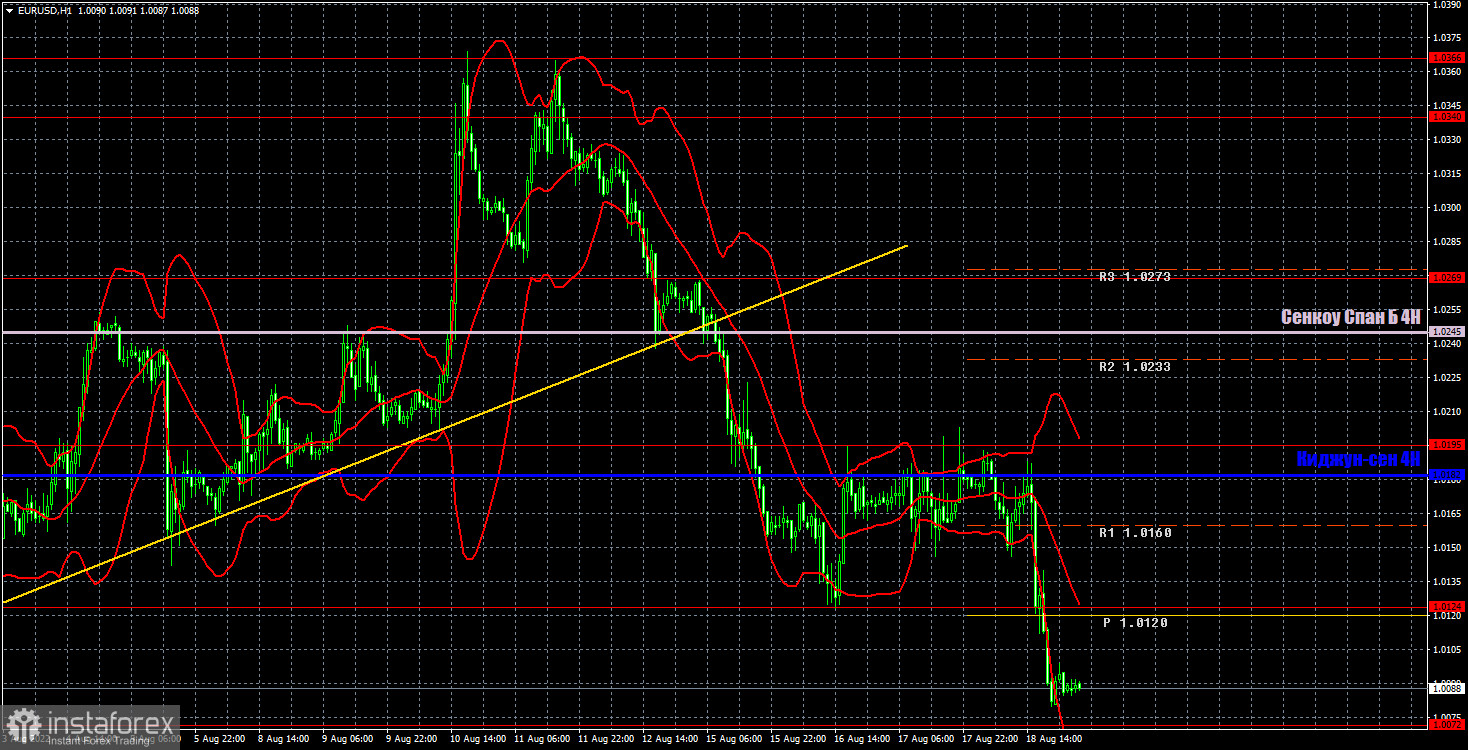
The pair continues to form a downward trend on the hourly timeframe. We believe that globally everything is going according to plan, as the euro corrected up by 400 points, so now there are sufficient technical reasons for the resumption of the downward trend. Macroeconomic statistics did not affect the course of trading this week, and the pair showed the best movement on those days when there were no statistics at all. We highlight the following levels for trading on Friday - 1.0000, 1.0072, 1.0124, 1.0195, 1.0269, as well as Senkou Span B (1.0245) and Kijun-sen (1.0182). Ichimoku indicator lines can move during the day, which should be taken into account when determining trading signals. There are also secondary support and resistance levels, but no signals are formed near them. Signals can be "rebounds" and "breakthrough" extreme levels and lines. Do not forget about placing a Stop Loss order at breakeven if the price has gone in the right direction for 15 points. This will protect you against possible losses if the signal turns out to be false. There will be no important statistics or other events in the European Union and the United States on August 19. But, as practice shows, traders actively trade just on such days.
Explanations for the chart:
Support and Resistance Levels are the levels that serve as targets when buying or selling the pair. You can place Take Profit near these levels.
Kijun-sen and Senkou Span B lines are lines of the Ichimoku indicator transferred to the hourly timeframe from the 4-hour one.
Support and resistance areas are areas from which the price has repeatedly rebounded off.
Yellow lines are trend lines, trend channels and any other technical patterns.
Indicator 1 on the COT charts is the size of the net position of each category of traders.
Indicator 2 on the COT charts is the size of the net position for the non-commercial group.


