GBP/USD 5M

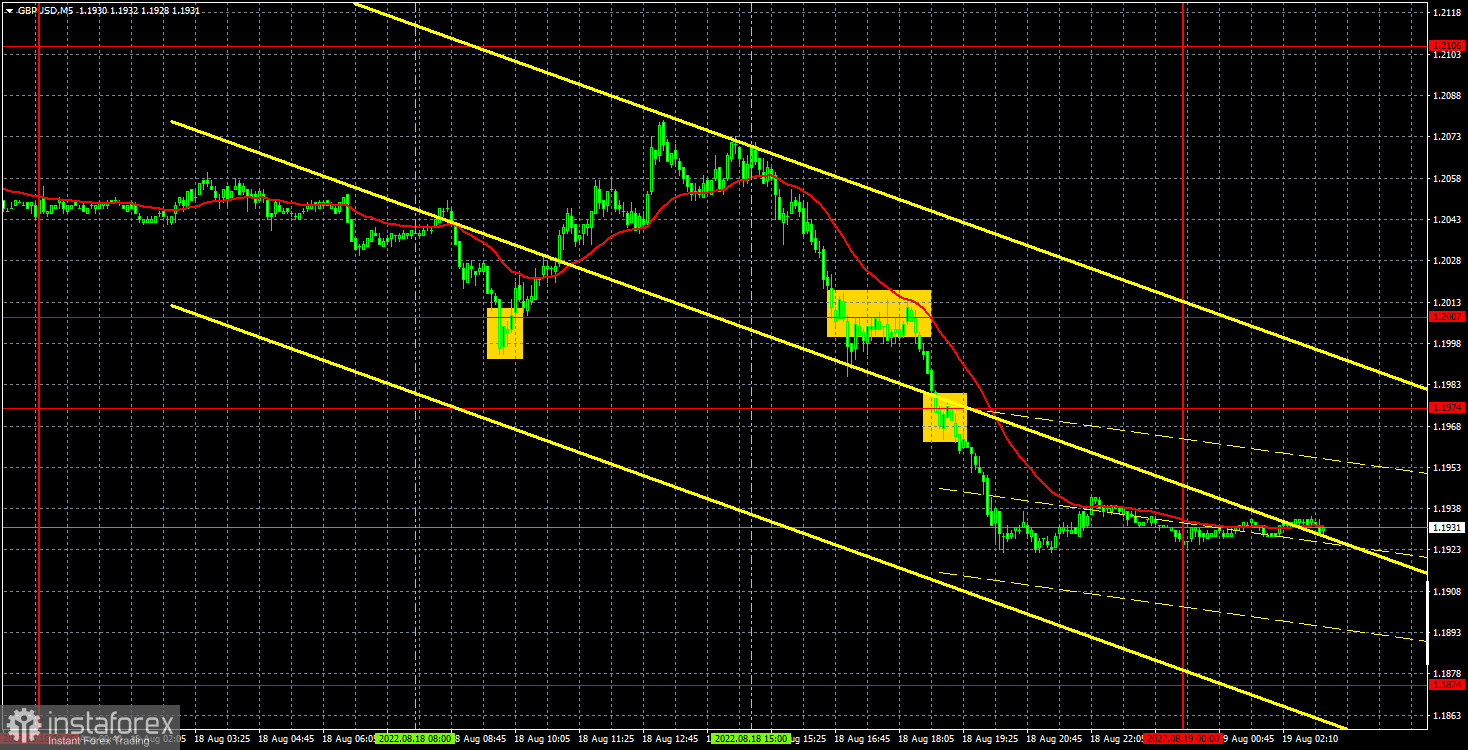
Yesterday, the GBP/USD currency pair failed to overcome the level of 1.2007 for the third time, but at the US trading session it nevertheless gathered strength and rushed down sharply. As we said in the article on the euro/dollar, there were no important statistics yesterday, and the fall was sharp, strong and unpredictable. It was impossible to predict such a collapse, although there is a downward trend in the pair, so in general we expected the British currency to continue depreciating. In principle, now everything is going according to plan. As expected, after the correction of both pairs by 400-500 points, global downtrends resumed, so the fundamental and geopolitical backgrounds have not changed at all in recent weeks. But a pair cannot move in the same direction all the time. So there was a correction. Macroeconomics now generally makes little sense to consider. Most of the reports are ignored, and the rest have only a local impact on the pair's movement.
The situation in regards to the trading signals for the pound is more complicated. The first buy signal was formed at the beginning of the European session and, despite the failure to reach the target level of 1.2106, it cannot be called false. Still, the price went up 60 points. However, it was possible to get some profit on a long position only by predicting a sharp downward reversal and manually closing the deal on time. The next signal - to sell - was formed when the level of 1.2007 was overcome. It was formed rather late, but one could try to work it out. After that, the price went down at least 70 points, breaking the level of 1.1974 on the way. The short position also had to be closed manually in the evening.
COT report:

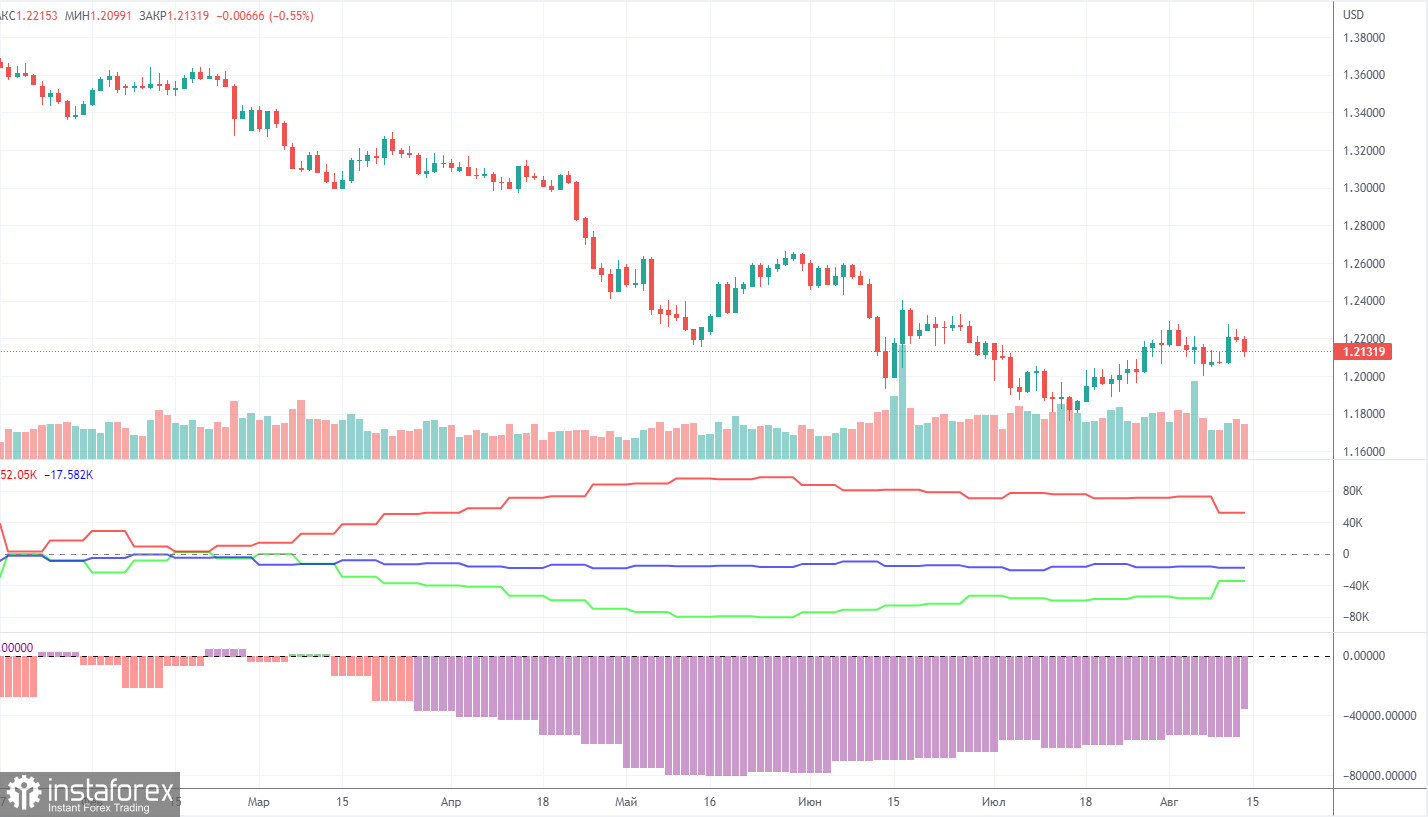
The latest Commitment of Traders (COT) report on the British pound has finally impressed. During the week, the non-commercial group opened 12,900 long positions and closed 9,000 short positions. Thus, the net position of non-commercial traders immediately increased by 21,900. This is quite a strong change for the pound. However, the mood of the big players still remains "pronounced bearish", which is clearly seen in the second indicator in the chart above (purple bars below zero = bearish mood). To be fair, in recent months the net position of the non-commercial group has been constantly growing, but the pound shows only a very weak tendency to increase. The growth of the net position and the growth of the pound itself are now so weak (if we talk globally), it's hard to draw a conclusion about the beginning of a new upward trend. It is rather difficult to call the current growth even a "correction". We also said that the COT reports do not take into account the demand for the dollar, which is likely to remain very high right now. Therefore, for the British currency to appreciate, the demand for it must rise faster and stronger than the demand for the dollar. And on the basis of what factors is the demand for the pound growing now? Traders have already been hard at work ignoring strong US data and a 0.75% Fed tightening in recent weeks. The pound could already go again to conquer 2-year lows.
The non-commercial group now has a total of 76,000 short positions and 42,000 long positions open. The net position will have to show growth for a long time to at least equalize these figures.
We recommend to familiarize yourself with:
Overview of the EUR/USD pair. August 19. Euro on the verge of another flat.
Overview of the GBP/USD pair. August 19. The British pound risks going into a wide horizontal channel.
Forecast and trading signals for EUR/USD on August 19. Detailed analysis of the movement of the pair and trading transactions.
GBP/USD 1H

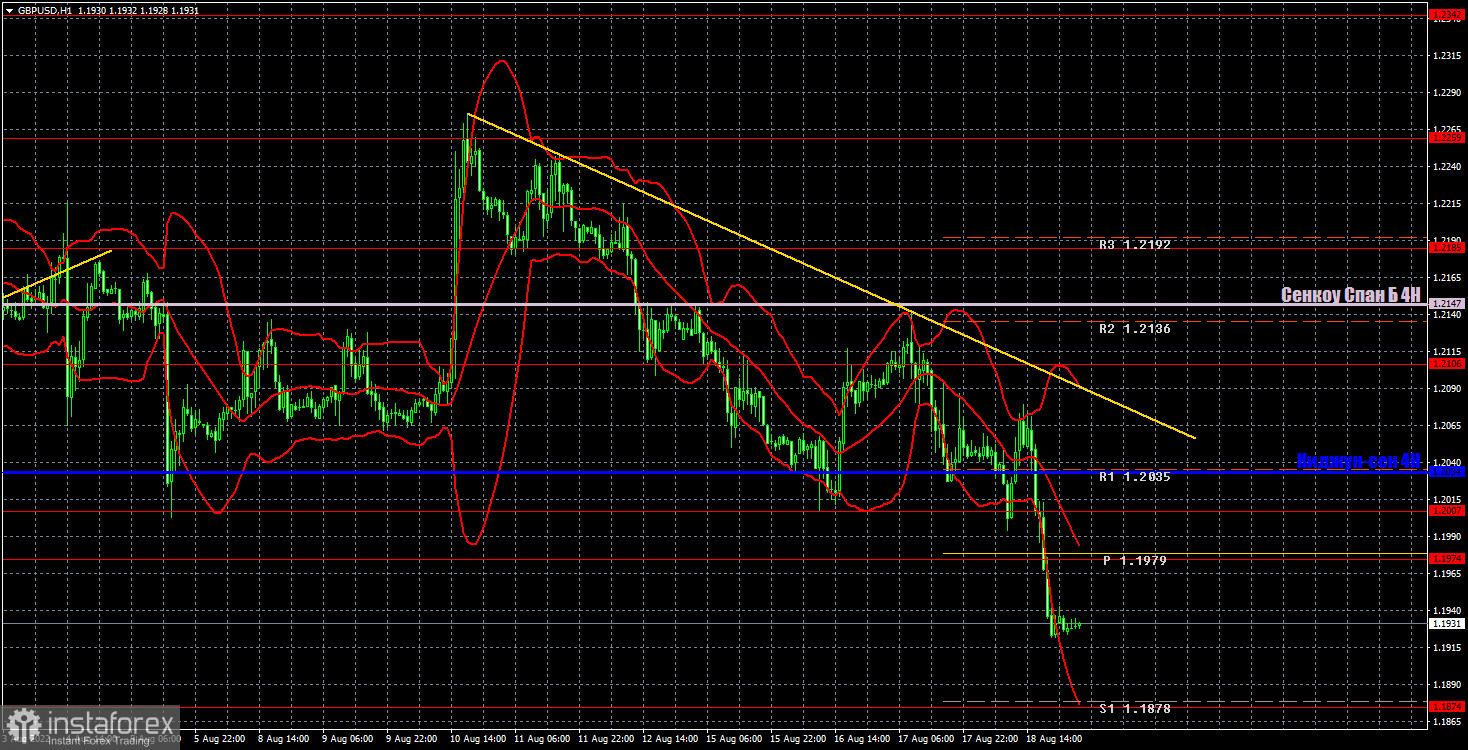
The pound/dollar pair continues its downward movement on the hourly timeframe, already under the influence of a descending trend line. As we expected, the pound aims to update 2-year lows, after which the road will be open to absolute lows around the 14th level. It is still very difficult to say what could keep the pound from a new strong fall. We highlight the following important levels for August 19: 1.1807, 1.1874, 1.1974, 1.2007, 1.2106, 1.2185, 1.2259. Senkou Span B (1.2147) and Kijun-sen (1.2034) lines can also be sources of signals. Signals can be "rebounds" and "breakthroughs" of these levels and lines. The Stop Loss level is recommended to be set to breakeven when the price passes in the right direction by 20 points. Ichimoku indicator lines can move during the day, which should be taken into account when determining trading signals. The chart also contains support and resistance levels that can be used to take profits on trades. The UK retail sales report is scheduled for Friday, but as the pound crashed yesterday, one wonders if it even needs this statistic? We do not believe that the market reaction to this report will exceed 20-30 points, if any. And we do not expect any significant reports from the US today.
Explanations for the chart:
Support and Resistance Levels are the levels that serve as targets when buying or selling the pair. You can place Take Profit near these levels.
Kijun-sen and Senkou Span B lines are lines of the Ichimoku indicator transferred to the hourly timeframe from the 4-hour one.
Support and resistance areas are areas from which the price has repeatedly rebounded off.
Yellow lines are trend lines, trend channels and any other technical patterns.
Indicator 1 on the COT charts is the size of the net position of each category of traders.
Indicator 2 on the COT charts is the size of the net position for the non-commercial group.


