


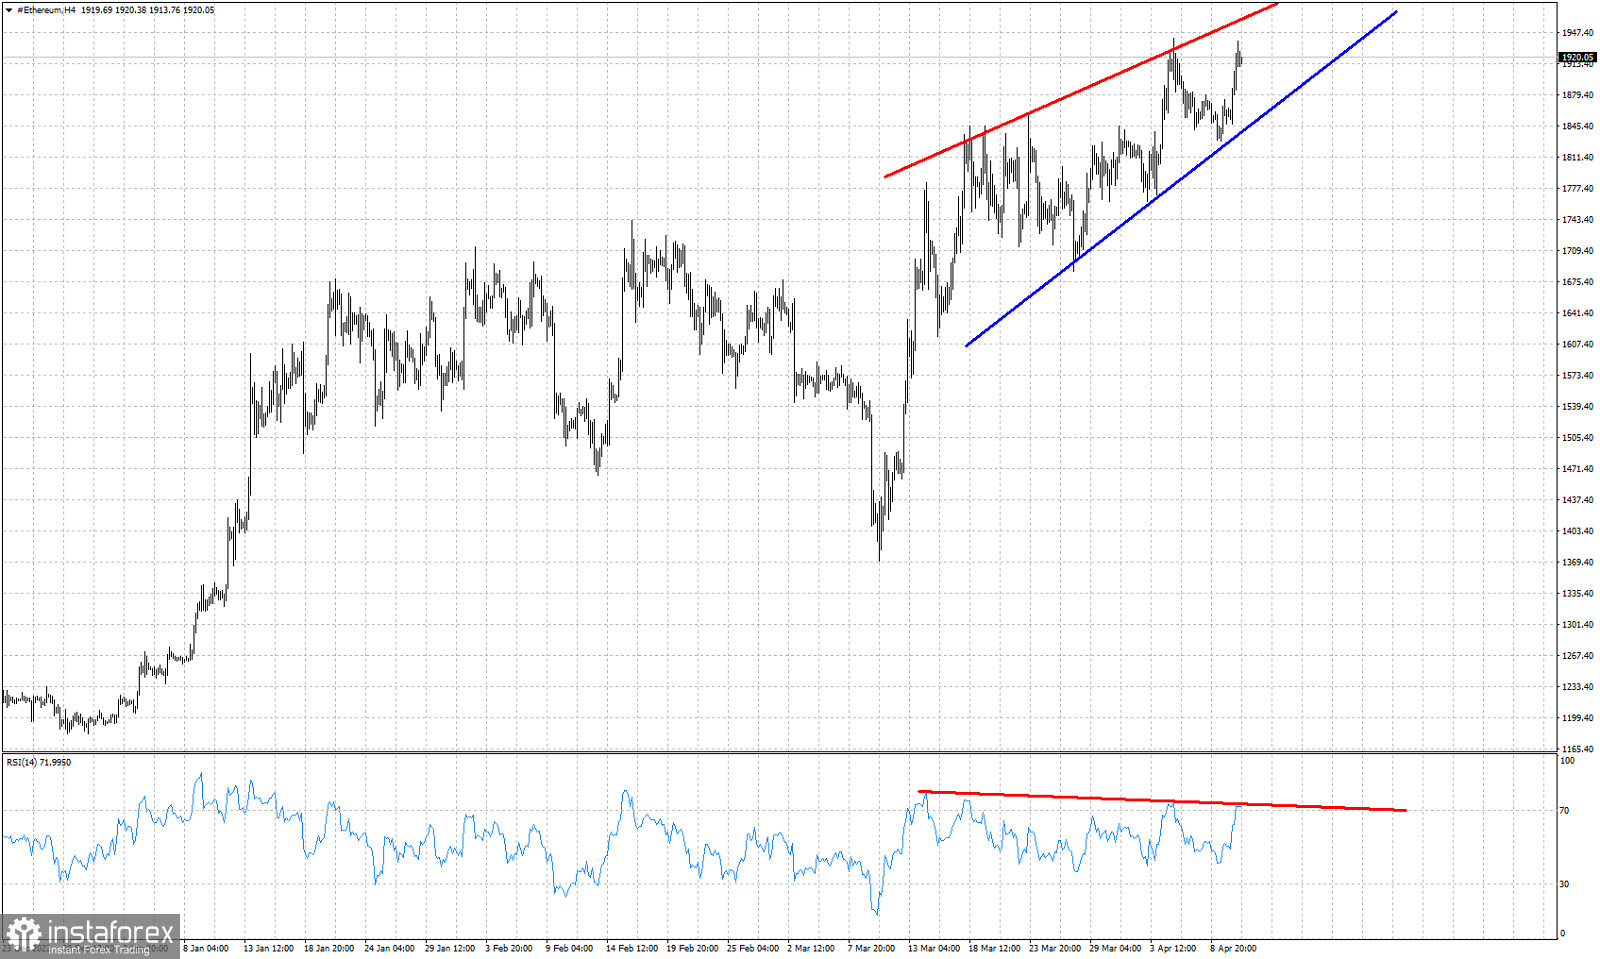
Red lines- bearish RSI divergence
Blue line- support trend line
Ethereum is trading around $1,920. Short-term trend remains bullish as price continues making higher highs and higher lows. Trend remains bullish but there are some warning signs by the RSI. The RSI is not making higher highs, On the contrary the RSI provides bearish divergence signals. Recent price action since mid March looks like a formation of an upward sloping wedge pattern. Support by the blue trend line is at $1,844. The combination of a bearish divergence and the wedge pattern makes us more cautious. If combined with a break below $1,844 it would be a bearish reversal signal.


