


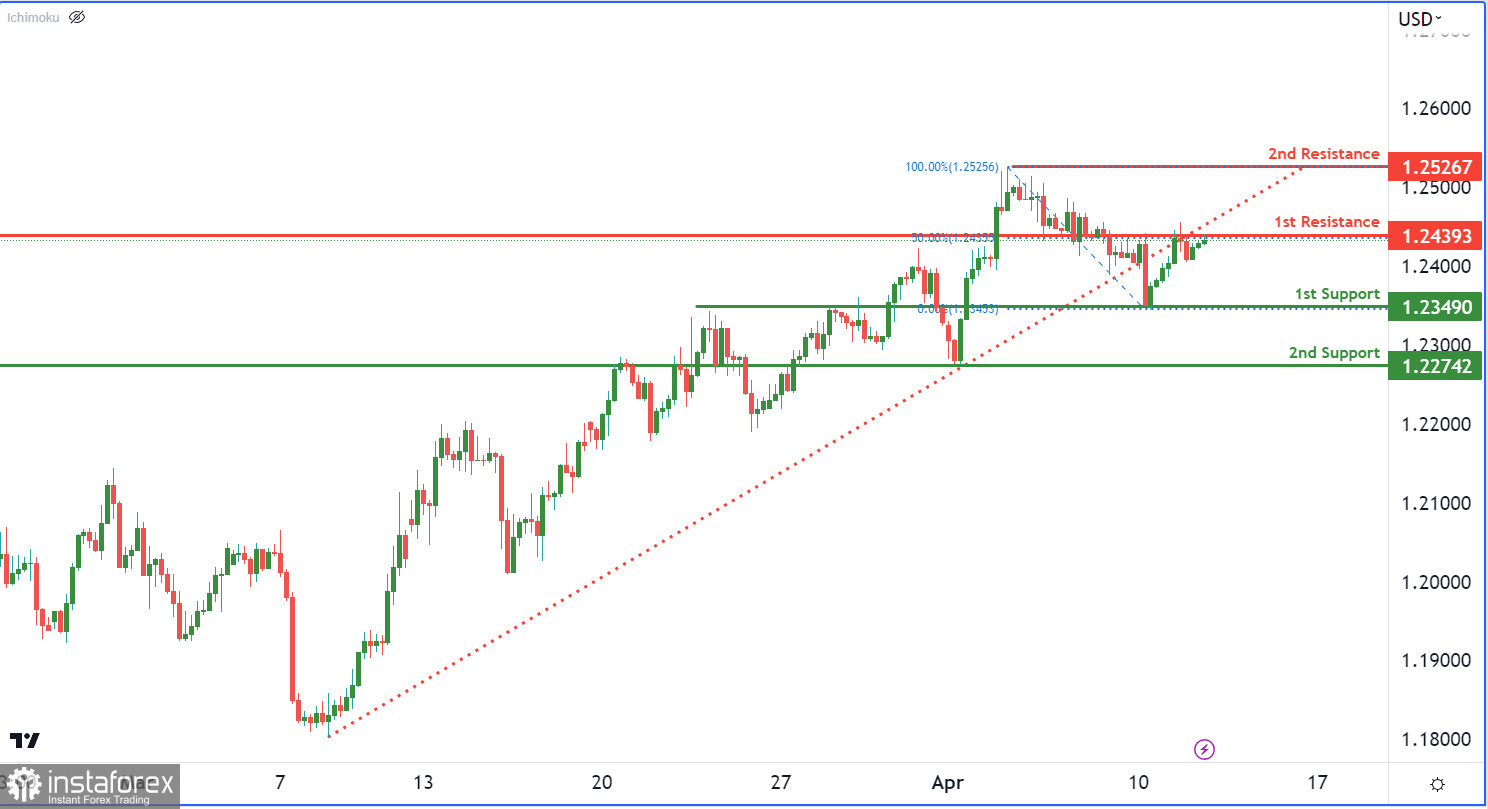
The GBP/USD currency pair is currently showing a bearish momentum on the chart, as the price has broken below an ascending support line. This suggests a potential bearish move, and if the downtrend continues, it may prompt a bearish reaction at the first resistance level, leading to a drop to the first support level.
At 1.2349, the first support level is an overlap support level, which has acted as a support level in the past and may serve the same function again in the future. Similarly, the second support level at 1.2274 is also an overlap support level, which could potentially act as a support level if the price keeps falling.
In contrast, the first resistance level at 1.2439 is an overlap resistance level, coinciding with the 50% Fibonacci retracement level. If the price rises and reaches this level, it could face resistance and begin to decline towards the support levels.
Lastly, the second resistance level at 1.2526 is a multi-swing high resistance level, indicating its history of functioning as a resistance level and potential to do so again in the future.


