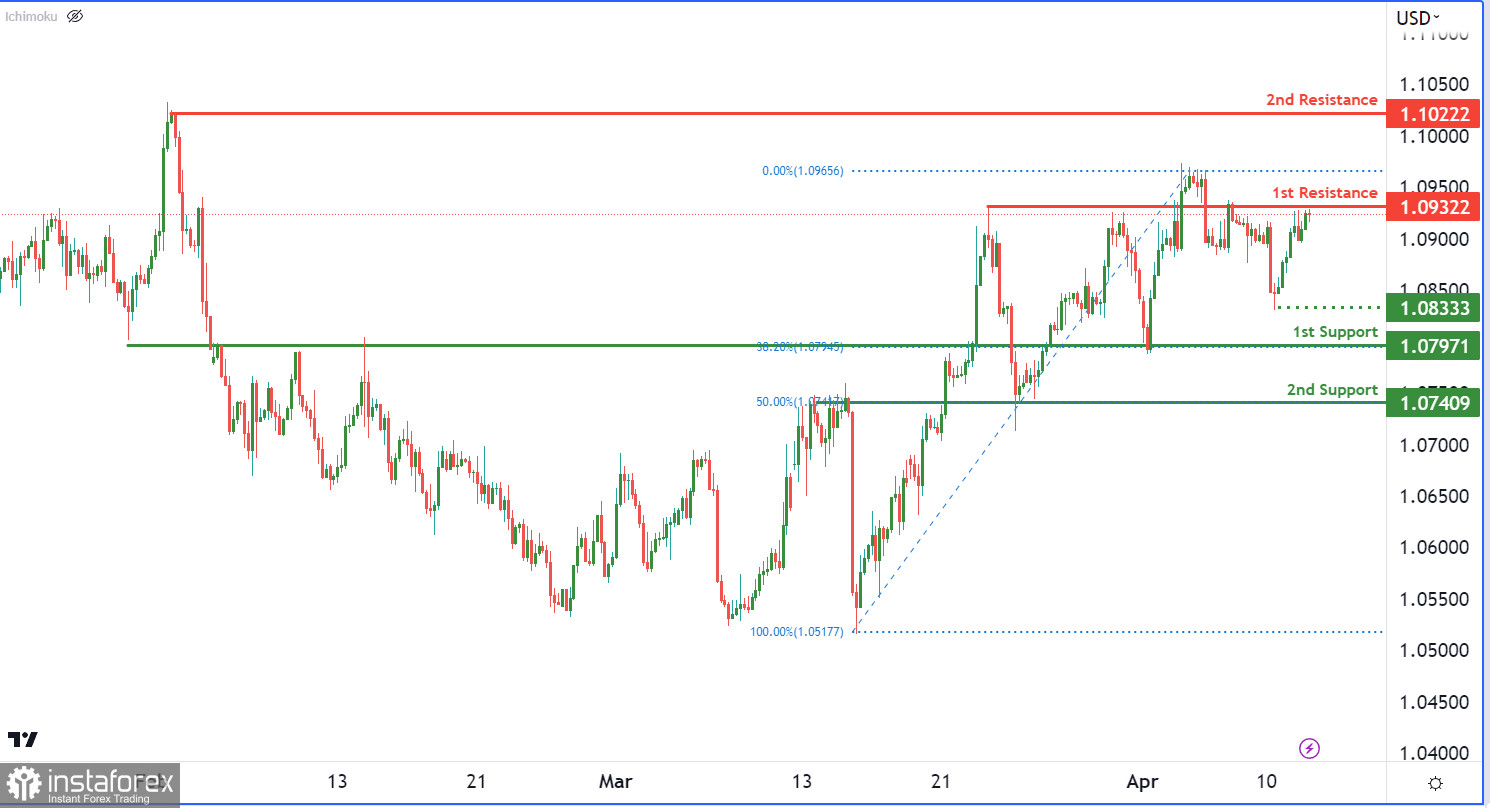
The EUR/USD chart is bearish, with potential for a bearish reaction at the first resistance level and a drop towards the first support level. The first support level, at 1.0797, coincides with the 38.20% Fibonacci retracement level and is a strong overlap support level. The second support level, at 1.0740, is another overlap support level and coincides with the 50% Fibonacci retracement level. Conversely, the first resistance level is at 1.0932, an overlap resistance level, while the second resistance level is at 1.1022, a swing high resistance level. If the price breaks above the first resistance, it could rise towards the second resistance.
However, if it drops below the first support, it could fall towards the second support. An intermediate support level at 1.0833 serves as a swing low support level.


