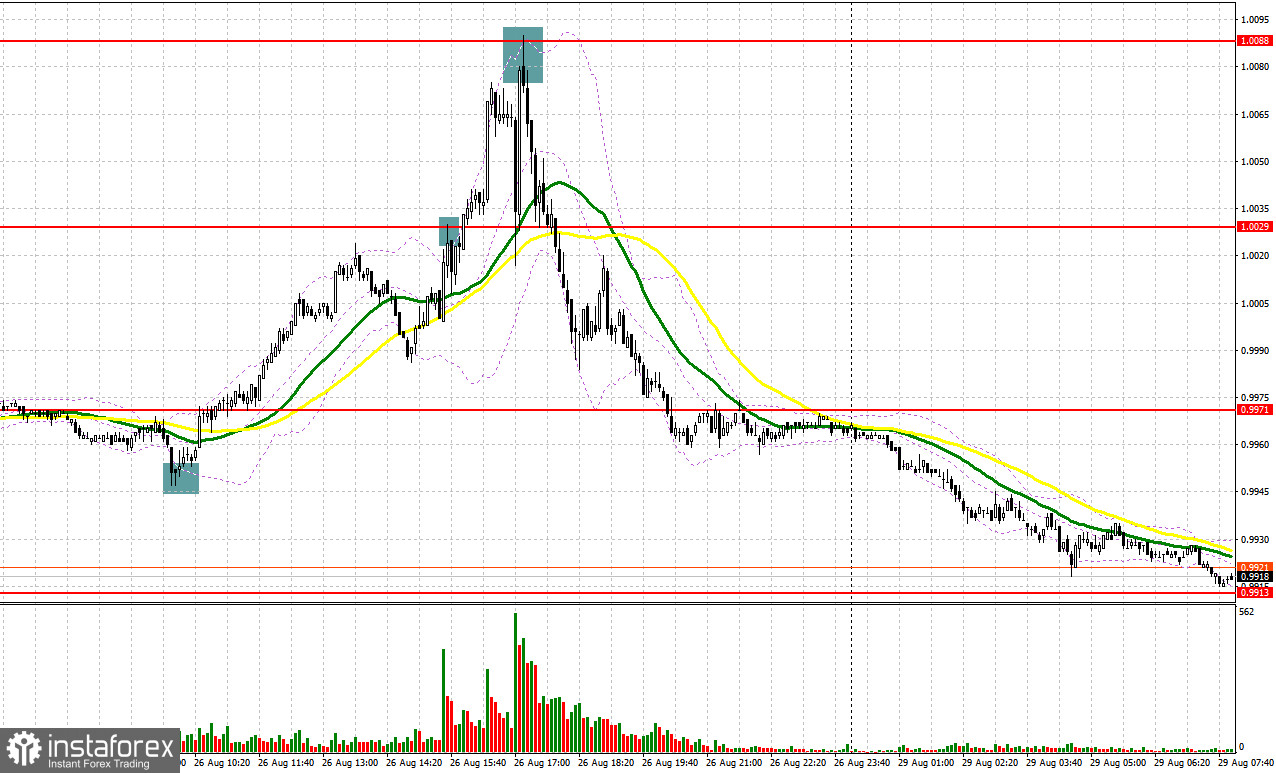
EUR/USD generated a few profitable market entry signals on Friday. Let's take a look at the 5-minute chart and try to figure out what actually happened. In my morning review on Friday, I advised you to pay attention to 0.9953 and recommended making decisions on market entry with this level in focus. The economic data on Germany was appalling which triggered EUR's downward move in the first half of the trading day, so EUR/USD updated support at 0.5593. A fake breakout at that level provided an excellent buy signal for EUR. As a result, EUR rose 50 pips. During the North American session, investors were riveted by Powell's speech. The currencypair failed to settle above 1.0029 before Powell's remarks which led to a sell signal. Later on, the best market entry point was after a fake breakout at 1.0088 where I recommended selling EUR immediately at a bounce. The trading instrument sank more than 100 points from that level.

What is needed to open long positions on EUR/USD
On Friday, Fed Chairman Jerome Powell said that restoring price stability would take some time and it would require using all the tools forcefully to bring demand and supply into better balance.Such remarks cemented expectations that the central bank would raise the federal funds rate by 0.75% at the nearest meeting in September. Such prospects pushed EUR down again. Such a state of affairs dampens demand for risky assets and might enable EUR/USD to update its one-year lows.
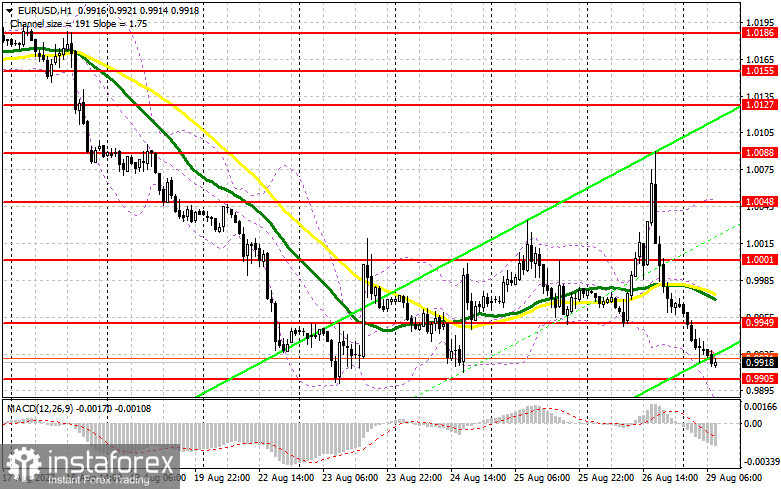
To prevent the pair from falling, the buyers should protect the nearest support at 0.9905. The economic calendar lacks any fundamental data today. Hence, it would be a challenge for the buyers. The buyers will receive a signal to open long positions on the condition of a fake breakout at 0.9905 in the hope of a EUR/USD's climb which will update resistance of 0.9949. A breakout and a test of this level downwards could happen on condition of renewed demand which is unlikely today. It will activate stop losses of the bears, generating an extra signal for opening long positionsunder the scenario of updating 1.0001. Moving averages are passing a bit lower which supports the sellers. If EUR/USD declines and the buyers lack activity at 1.9905 in the first half of the day, the currency pair will come under pressure again. In this case, the reasonable scenario for opening long positions will be a fake breakout at about the one-year low of 0.9861. I would recommend buying EUR/USD immediately at a dip from 0.9819 bearing in mind a 30-35-pip intraday upward correction.
What is needed to open short positions on EUR/USD
The major task for the sellers is to defend resistance at 0.9949 as well as to print one-year lows. This will signal that a bearish trend is in progress again. The reasonable scenario for opening short positions will be a false breakout at 0.9949 in the first half of the day that will push EUR down to about 0.9905. A breakout and consolidation below that level accompanied by the opposite test upwards will create an extra sell signal that will activate stop orders of the buyers. In turn, the pair might plunge to 0.9861 and lower to 0.9760 where I recommend profit-taking. The more distant target is seen at 0.9760. It seems quite realistic in the near time in light of the hawkish remarks from the Fed's leader. If case EUR/USD jumps during the European session and the bears lack activity at 0.9949, we will have an opportunity to take profit from short positions. Such activity will change the situation in the buyers' favor. In this case, I would recommend you cancel planning short positions until the price hits 1.0001 on condition of a fake breakout there. We could sell EUR/USD immediately at a bounce from 1.0048 or higher from 1.0088 bearing in mind a downward 30-35-pip correction intraday.

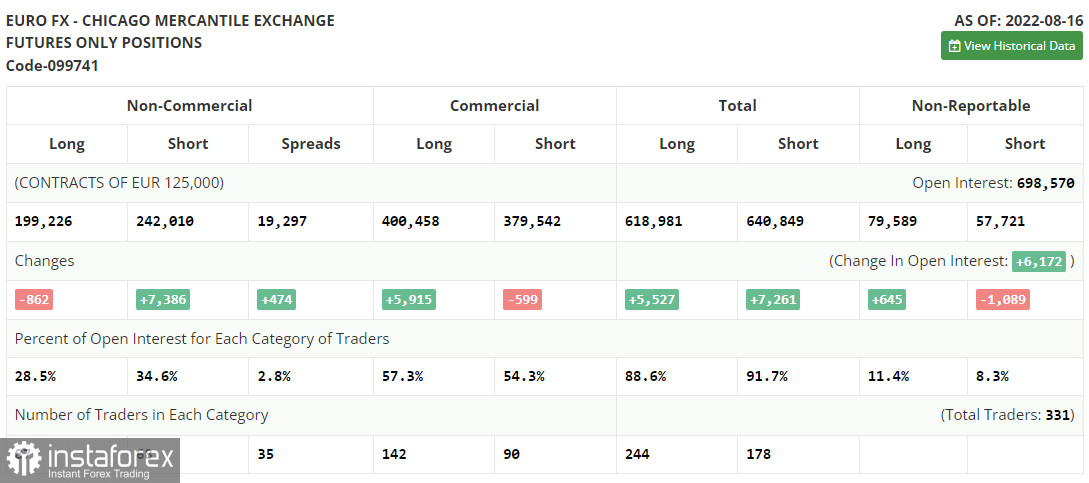
The COT (Commitment of Traders) report from August 16 logs a sharp increase in short positions and a contraction in long ones. It confirms the ongoing EUR's weakness versus USD. The risk of a looming recession in the US is accompanied by the risk of economic havoc in the EU that is on the horizon this autumn on the back of a long-standing rally of energy prices and further inflation acceleration. The ECB has not achieved any notable progress in its struggle against inflation so far. At the end of August, American policymakers are due to assemble at Jackson Hole. Fed's Chairman Jerome Powell will make a keynote speech.
His rhetoric will set the tone for a further dynamic in EUR/USD. For the time being, the overvalued US dollar hurts the US economy and is to blame for rampant inflation against which the US central bank is taking drastic counter-measures. According to the latest COT report, long non-commercial positions dropped by 862 to 199,226 whereas short non-commercial positions surged by 7,386 to 242,010. Eventually, the total non-commercial positions remained negative and contracted to -42,784 versus -34,536 a week ago. It means that EUR is weighed down again and the currencypair is doomed for weakness. EUR/USD closed last week at 1.0191 against 1.0233 at the previous week.

Indicators' signals:
The currency pair is trading below the 30 and 50 daily moving averages. It indicates a further decline in EUR/USD.
Moving averagesNote: The period and prices of moving averages are considered by the author on the H1 hourly chart and differ from the general definition of the classic daily moving averages on the daily D1 chart.
Bollinger BandsIf EUR/USD goes down, the indicator's lower border at 0.9885 will serve as support. Otherwise, if the currency pair grows, the upper border at nearly 1.0048 will act as resistance.
Description of indicators
Moving average (moving average, determines the current trend by smoothing out volatility and noise). Period 50. It is marked yellow on the chart.
Moving average (moving average, determines the current trend by smoothing out volatility and noise). Period 30. It is marked green on the chart.
MACD indicator (Moving Average Convergence/Divergence — convergence/divergence of moving averages) Quick EMA period 12. Slow EMA period to 26. SMA period 9
Bollinger Bands (Bollinger Bands). Period 20
Non-commercial speculative traders, such as individual traders, hedge funds, and large institutions that use the futures market for speculative purposes and meet certain requirements.
Long non-commercial positions represent the total long open position of non-commercial traders.
Short non-commercial positions represent the total short open position of non-commercial traders.
Total non-commercial net position is the difference between short and long positions of non-commercial traders.


