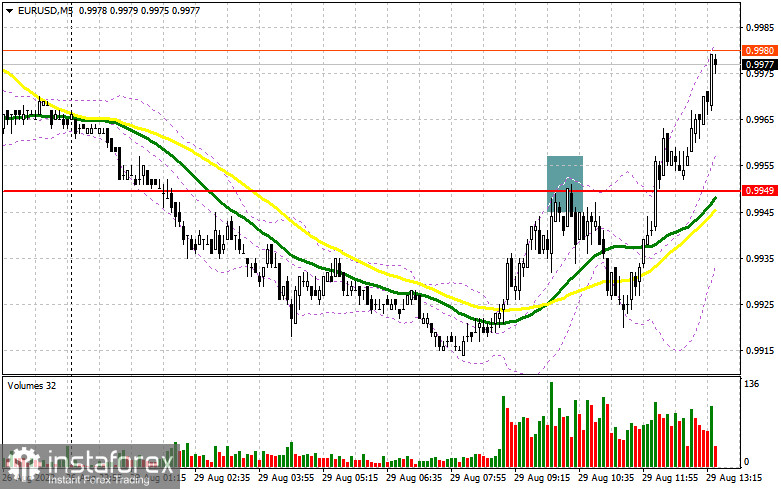
In the morning article, I highlighted the level of 0.9949 and recommended making decisions with this level in focus. Now, let's look at the 5-minute chart and try to figure out what actually happened. After the first upward correction, the sellers managed to defend the 0.9949 level. It gave an excellent sell signal. The pair dropped by 30 pips. However, it did not reach new lows. After another test of 0.9949, a breakout took place. For the second half of the day, the technical outlook has changed as well as the trading strategy.

What is needed to open long positions on EUR/USD
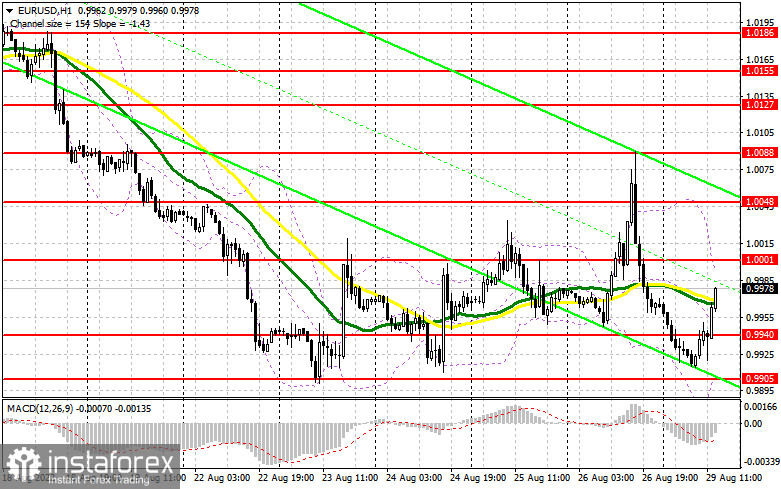
The sellers may assert strength again given that the economic calendar for the American session is almost empty. Traders are anticipating only Lael Brainard's speech. If the policymaker touches upon the topic of monetary tightening, the bears could regain ground. Therefore, the main task of the bulls is to protect the nearest support level of 0.9940, formed in the morning. Only a false breakout if this level will provide a buy signal with the prospect of a further rise to the resistance level of 1.0001. A breakout and a downward test of this level will force the bears to close their Stop Loss orders. Traders may start opening long positions above the parity level. It will open the way to a correction to 1.0048. A more distant target will be the resistance level of 1.0088 where I recommend locking in profits. If EUR/USD declines and the bulls show no activity at 0.9940 in the afternoon, the pressure on the pair will escalate. The optimal scenario for opening long positions will be a false breakout of the yearly low of 0.9905. You can buy EUR/USD immediately at a bounce from 0.9861 or near the parity level of 0.9819, keeping in mind an upward intraday correction of 30-35 pips.
What is needed to open short positions on EUR/USD
Market volatility continues to confuse traders. At first glance, it may seem that after Jerome Powell's speech, the rally of the US dollar is likely to persist. However, the situation is a bit more complicated. As the bears have failed to push the pair to the resistance level of 0.9949, they have certainly loosened their grip. They need to protect 1.0001. The optimal scenario for opening short positions will be a false breakout of this level, which will provide a sell signal. The pair may drop to 0.9940. A sell single may appear after a breakout below this level, new speeches of Fed members, and an upward test of 0.9940. If this scenario comes true, the pair could plummet to 0.9905 where I recommend locking in profits. A more distant target will be the 0.9861 level. If EUR/USD rises in the afternoon and the bears show no energy at 1.0001, the bulls will regain control. If so, it is better to postpone short positions to 1.0048 but only if a false breakout occurs. You can sell EUR/USD at a bounce from 1.0088 or a high of 1.0127, keeping in mind an intraday downward correction of 30-35 pips.

COT report
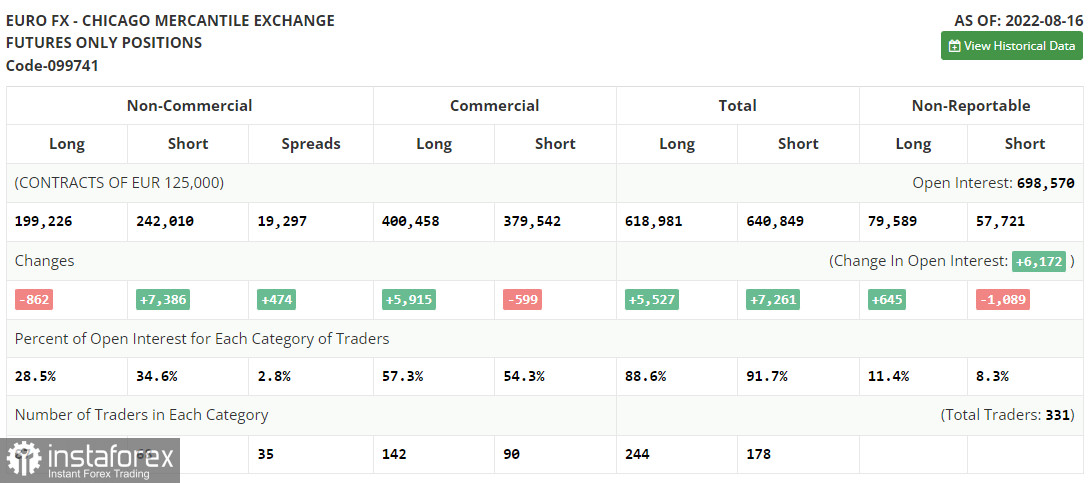
The COT (Commitment of Traders) report from August 16 logged a sharp increase in short positions and a drop in long ones. It has once again confirmed the weakness of the euro versus the US dollar. The risk of a looming recession in the US is accompanied by the risk of economic havoc in the EU. The euro area could face serious economic problems this autumn due to soaring energy prices and runaway inflation. The ECB has not been able so far to take inflation under control. At the end of August, the Jackson Hole Symposium will take place. Fed's Chairman Jerome Powell will make a crucial speech. The tone of his speech will set the log-tern trend for EUR/USD. Currently, the overvalued US dollar hurts the US economy by boosting inflation which the US central bank is desperately trying to curb. The latest COT report revealed that the number of long non-commercial positions dropped by 862 to 199,226, while the number of short non-commercial positions surged by 7,386 to 242,010. Eventually, the total non-commercial positions remained negative and contracted to -42,784 versus -34,536 a week ago. It means that EUR is in the bears' claws. It is likely to decline further. EUR/USD closed last week at 1.0191 against 1.0233 in the previous week.

Indicators' signals:
The EUR/USD pair is trading near the 30 and 50 daily moving averages. It indicates the likelihood of a trend reversal.
Moving averages
Note: The period and prices of moving averages are considered by the author on the H1 hourly chart and differ from the general definition of the classic daily moving averages on the daily D1 chart.
Bollinger Bands
If EUR/USD goes down, the indicator's lower border at 0.9905 will serve as support. Otherwise, if the currency pair grows, the upper border at 1.0001 will act as resistance.
Definitions of technical indicators
- Moving average recognizes an ongoing trend through leveling out volatility and market noise. A 50-period moving average is plotted yellow on the chart.
- Moving average identifies an ongoing trend through leveling out volatility and market noise. A 30-period moving average is displayed as the green line.
- MACD indicator represents a relationship between two moving averages that is a ratio of Moving Average Convergence/Divergence. The MACD is calculated by subtracting the 26-period Exponential Moving Average (EMA) from the 12-period EMA. A 9-day EMA of the MACD called the "signal line".
- Bollinger Bands is a momentum indicator. The upper and lower bands are typically 2 standard deviations +/- from a 20-day simple moving average.
- Non-commercial traders - speculators such as retail traders, hedge funds, and large institutions who use the futures market for speculative purposes and meet certain requirements.
- Non-commercial long positions represent the total long open position of non-commercial traders.
- Non-commercial short positions represent the total short open position of non-commercial traders.
- The overall non-commercial net position balance is the difference between short and long positions of non-commercial traders.


