


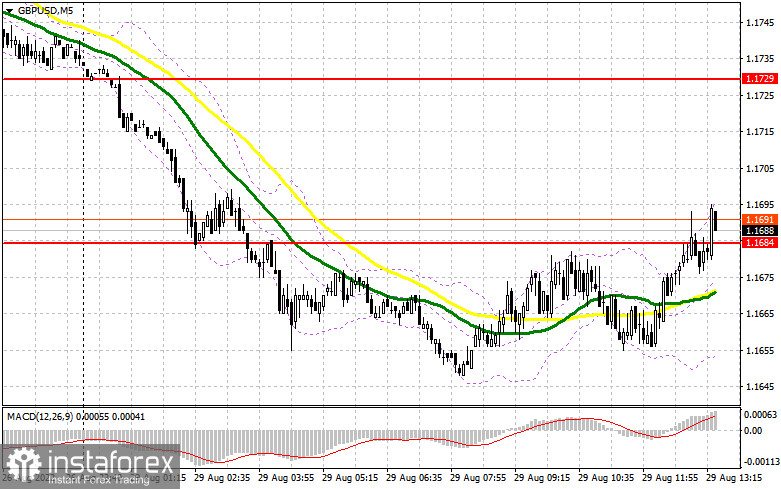
The first half of the day showed weak trading activity, as there were no signals to enter the market. In my morning forecast, I paid attention to the level of 1.1684 but the price lacked just a few pips to make a false breakout there. For this reason, I have not seen any signal to enter the market. In the second half of the day, the technical picture slightly changed but volatility is expected to remain reasonably restrained.
Long positions on GBP/USD:
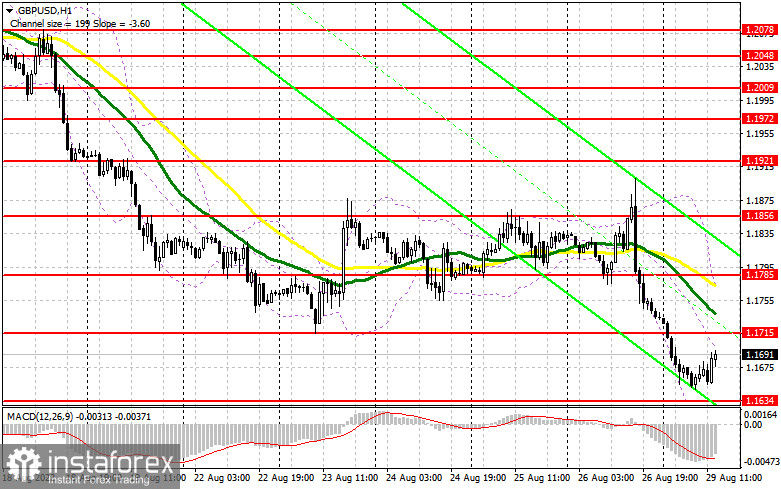
I will count on the speech of FOMC member Lael Brainard and a surge in volatility, especially after Friday's drop in the pound. The support of the strategy of Fed Chairman Jerome Powell by his peers might play on the side of the US dollar, and then we may see the GBP/USD pair falling further. If the pair declines, bulls should protect the yearly low near 1.1634. Only a false breakout at that level may form a buy signal with the aim of recovery to the area of 1.1715. A breakthrough and a reverse top/bottom test of that area are likely to support bulls, opening the way to 1.1785, where the moving averages are on the bears' side. The next target is 1.1856, where traders may lock in profits. A test of that level may become a real challenge for bears, so pay close attention to it. In case the GBP/USD pair falls and bulls show weak activity at 1.1634, they will surely have trouble. Below the level of 1.1634, there is only 1.1573, from which you may open long positions if a false breakout is formed. You may also buy the pound on a rebound from 1.1499 or lower near 1.1419, allowing an intraday correction of 30-35 pips.
Short positions on GBP/USD:
It is very important for the bears to defend the resistance of 1.1715. If the price forms a false breakout at that level, I expect the GBP/USD pair to resume its decline and return to the yearly lows. A breakthrough at this level may occur if we hear dovish statements of the Fed's representative Brainard, which is unlikely to occur. A false breakout at 1.1715 may support bears, which will strengthen the bearish market and allow bears to expect the price to drop to the area of 1.1634. A breakthrough and a reverse bottom/top test of this range may give a sell entry point with the target at 1.1573 and below at the lows of 1.1499 and 1.1419. If the GBP/USD pair grows and we see a lack of activity from bears at 1.1715, bulls will have a real chance to correct and develop a sharper upward movement. In that case, it would be better to postpone selling the pound. Only a false breakout near 1.1785 is likely to give an entry point to short positions. You can sell the pound on a rebound from the level of 1.1856, allowing a downward intraday correction of 30-35 pips.
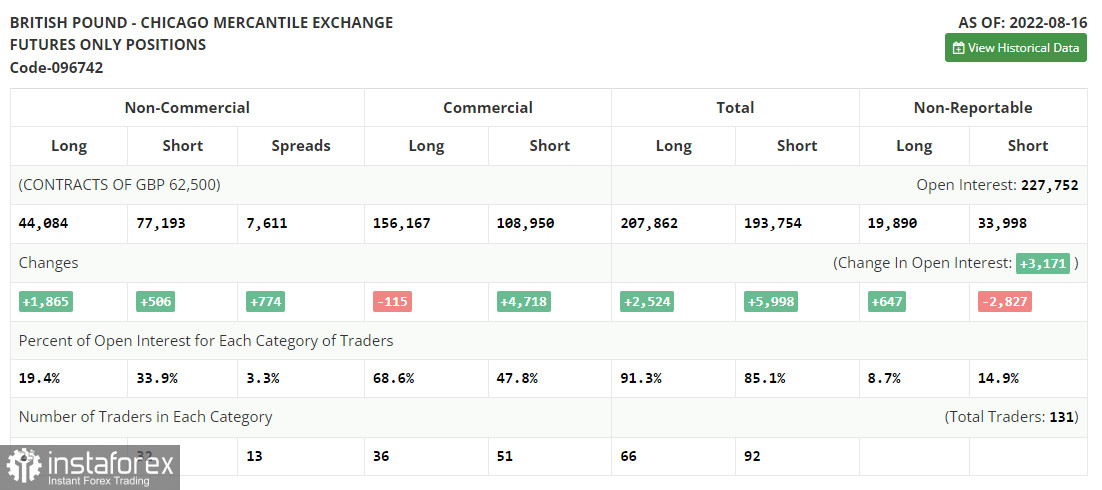
The COT report for August 16 logged an increase in both short and long positions, but these changes do not reflect the real picture. The serious pressure on the pair, which started in the middle of last week, still persists. Probably, there will be fewer market participants willing to buy the pound in such difficult macroeconomic conditions. We have the meeting at Jackson Hole ahead, which may lead to even more strengthening of the US dollar against the pound. This may happen if Chairman Jerome Powell announces he will maintain the committee's previous stance on aggressive interest rate increases aimed at fighting inflation and bringing it back to normal. The latest COT report showed that long non-commercial positions rose by 1,865 to 44,084, while short non-commercial positions rose by 506 to 77,193, reducing the negative non-commercial net position to -33,109 against -34,468. The weekly closing price was unchanged at 1.2096 against 1.2078.
- Moving average defines the current trend by smoothing out market volatility and noise. Period 50. Marked in yellow on the chart.
- Moving average defines the current trend by smoothing out market volatility and noise. Period 30. Marked in green on the chart.
- MACD (Moving Average Convergence/Divergence) indicator Fast EMA of period 12. Slow EMA period 26. SMA period 9
- Bollinger Bands. Period 20
- Non-commercial traders are speculators, such as individual traders, hedge funds, and large institutions, which use the futures market for speculative purposes and meet certain requirements.
- Long non-commercial positions represent the total long open position of non-commercial traders.
- Short Noncommercial positions represent the total short open position of noncommercial traders.
- Total non-commercial net position is the difference between short and long positions of non-commercial traders.


