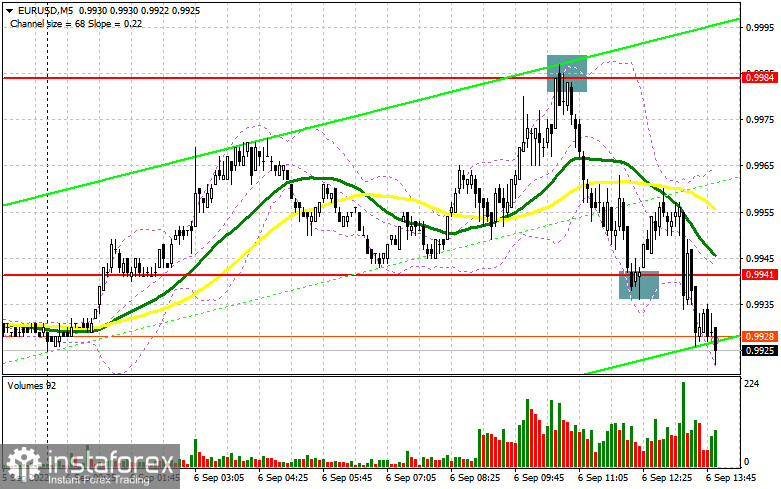
In the morning article, I highlighted the level of 0.9984 and recommended making decisions with this level in focus. Now, let's look at the 5-minute chart and try to figure out what actually happened. Germany's weak economic data somewhat impacted the trajectory of the euro. A sell signal appeared amid a false breakout of 0.9984 and the failure of bulls to push the price above this level. The pair dropped by 40 pips. The bulls tried to regain the upper hand. As a result, there was a buy signal around 0.9941 thanks to a false breakout. However, after a 15 pip increase, the pressure on the EUR/USD pair returned. For the afternoon, the technical outlook has changed.

What is needed to open long positions on EUR/USD
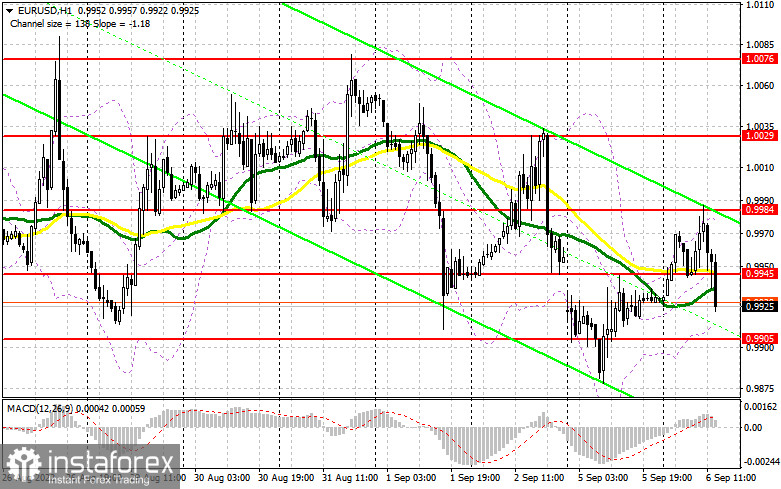
Today, traders are looking forward to the release of the US Markit Composite PMI Index and the ISM Non-Manufacturing Index. These reports are likely to affect the short-term trajectory of the pair. If the figures are downbeat, the euro could jump to the new resistance level of 0.9945. I strongly advise keeping this level in focus. At this level, the moving averages are already passing in negative territory. If the reports are positive, which is highly likely, the euro could drop significantly. If the pair decreases, only a false breakout of the nearest support level of 0.9905 will give a buy signal. In this case, the pair may return to 0.9945. A breakout and a downward test of this level will force bears to close their Stop Loss orders. Traders will be more willing to buy the euro, which could bring it closer to the parity level. Today, the pair failed to climb to this level. Bulls need to push the price above 0.9984 so that it could hit the parity level in the near future. A more distant target will be the resistance level of 1.0029 where I recommend locking in profits. If EUR/USD decreases and bulls show no activity at 0.9905 in the afternoon, the pressure on the pair will escalate. It is likely to trade in the downward channel formed on August 31. The optimal scenario for opening long positions will be a false breakout near a low of 0.9864. You can buy EUR/USD at a bounce from 0.9819 or 0.9770 located near the parity level, keeping in mind an upward intraday correction of 30-35 pips.
What is needed to open short positions on EUR/USD
Sellers managed to take control in the first half of the day. Now, they are aiming to push the price to a daily high of 0.9905. However, if they want to regain momentum, they need to protect the nearest resistance level of 0.9945. A move to this level will surely occur after the publication of the US Composite Index. The optimal scenario for opening short positions will be a false breakout of 0.9945. It will provide a sell signal and further movement of the euro to 0.9905. A breakout below this level, as well as an upward test, will give an additional sell signal. As a result, the pair could decline to a new annual low of 0.9864 where I recommend locking in profits. A more distant target will be the 0.9819 level. If EUR/USD rises in the afternoon and bears show no energy at 0.9945, it is better to open short positions around the resistance level of 0.9984. It is recommended to open short positions there only if a false breakout similar to one that occurred in the first half of the day. You can sell EUR/ USD at a bounce from a high of 1.0029 or 1.0076, keeping in mind a downward intraday correction of 30-35 pips.

COT report
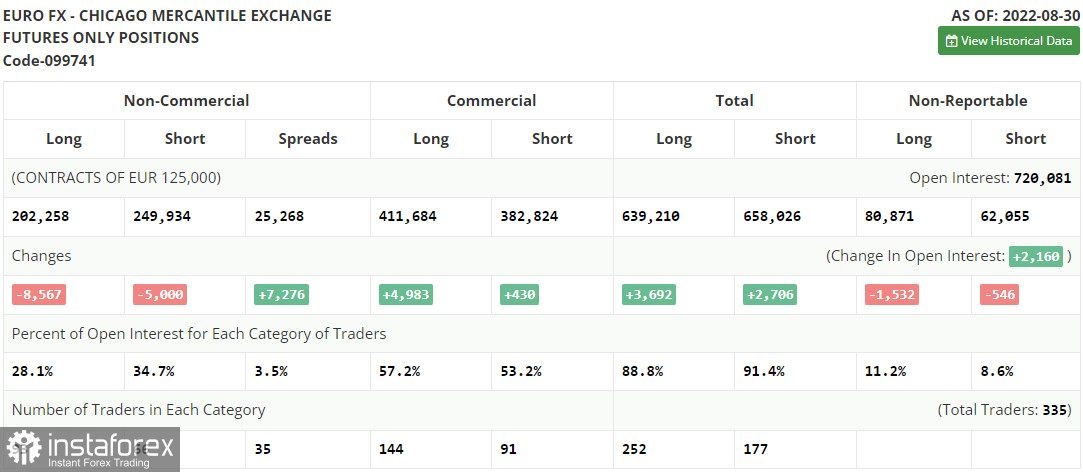
The COT report (Commitment of Traders) for August 30 logged a drop in both short and long positions. If a week ago there was a surge in trading activity, now it is gradually declining. It also signals a decrease in risk appetite after the release of the eurozone CPI data. The fresh figure soared to a new high. The market sentiment also turned sour due to the ongoing energy crisis. Russia halted gas supplies through its key pipeline. It may trigger another increase in energy prices in winter. If so, it will considerably boost inflation. It may force the European Central Bank to raise interest rates more aggressively. This week, the ECB is going to announce its key rate decision, which may weaken the euro against the US dollar. Although a rate increase may stir up EU Treasury bond yields, there is also a likelihood of a slowdown in economic growth. For this reason, the euro is unlikely to recover in the medium term. The COT report revealed that the number of long non-commercial positions decreased by 8,567 to the level of 202,258, while short non-commercial positions decreased by 5,000 to 249,934. At the end of the week, the total non-commercial net position remained negative and dropped to -47,676 against -44,109. Apparently, bears are still holding the upper hand. Therefore, the euro is likely to fall lower. The weekly closing price rose slightly and amounted to 1.0033 against 0.9978.

Signals of technical indicators
Moving averages
EUR/USD is trading below 30- and 50-period moving averages, signaling a further drop in the euro.
Remark. The author is analyzing the period and prices of moving averages on the 1-hour chart. So, it differs from the common definition of classic daily moving averages on the daily chart.
Bollinger Bands
If the EUR/USD pair declines, the lower border around 0.9920 will act as support.
Definitions of technical indicators
- Moving average recognizes an ongoing trend through leveling out volatility and market noise. A 50-period moving average is plotted yellow on the chart.
- Moving average identifies an ongoing trend through leveling out volatility and market noise. A 30-period moving average is displayed as the green line.
- MACD indicator represents a relationship between two moving averages that is a ratio of Moving Average Convergence/Divergence. The MACD is calculated by subtracting the 26-period Exponential Moving Average (EMA) from the 12-period EMA. A 9-day EMA of the MACD is called the "signal line".
- Bollinger Bands is a momentum indicator. The upper and lower bands are typically 2 standard deviations +/- from a 20-day simple moving average.
- Non-commercial traders - speculators such as retail traders, hedge funds, and large institutions who use the futures market for speculative purposes and meet certain requirements.
- Non-commercial long positions represent the total long open position of non-commercial traders.
- Non-commercial short positions represent the total short open position of non-commercial traders.
- The overall non-commercial net position balance is the difference between short and long positions of non-commercial traders.


