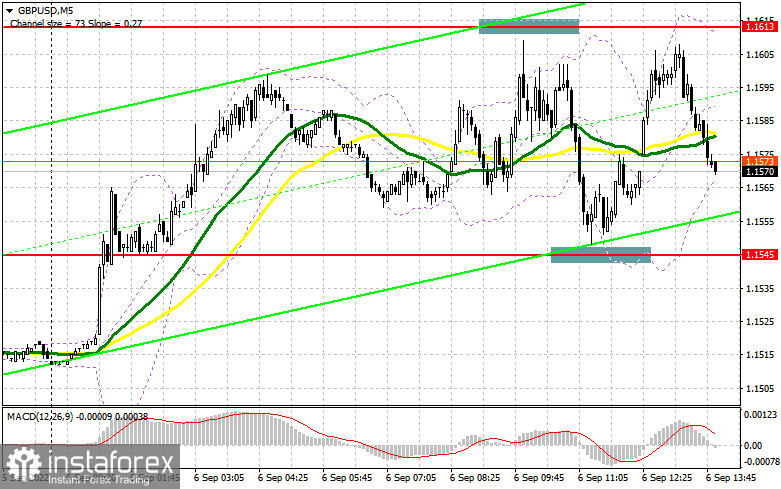
In the morning review, I turned your attention to 1.1613 and recommended making decisions with this level in focus. Let's analyze the 5-minute chart and try to figure out what actually happened. The price missed a couple of pips to make a false breakout at 1.1613. For this reason, I couldn't enter the market. A similar situation was about the level of 1.1554 where I expected a price reversal and more active growth. Sadly, the currency pair lacked 3-4 pips before it could test this area. Thus, I failed to buy GBP/USD. There were no other signals for the market entry in the first half of the day. Therefore, I had to revise the technical picture for the second half of the day.

What is needed to open long positions on GBP/USD
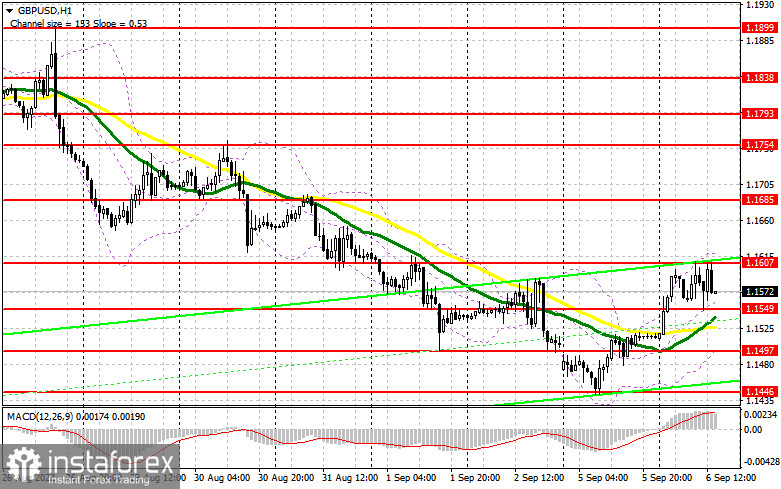
By and large, only technical levels have changed. The strategy itself remains the same. As I expect rather tepid economic data from the US in the second half of the day, the buyers have a fair chance for a further upward move and a breakout of 1.16. GBP/USD could sharply go down in case the composite PMI by Markit and the ISM manufacturing PMI turn out to be much stronger than expected. In this case, the buyers will have to try hard to defend the levels at around the nearest support of 1.1549 where moving averages are passing. They prop up the bulls.
Only a false breakout there will generate a buy signal with the upward target at 1.1607. A breakout and the opposite test of this area downward in case of poor economic data will be able to reinforce buying pressure, thus opening the way toward 1.1685. The more distant target is seen at the high of 1.1754 where I recommend profit-taking. If GBP/USD fall and the buyers don't reveal activity at 1.1549, the price is set to move down. Below this level, I foresee the low of 1.1497 where we will be able to build the lower border of the new upward correctional channel which is the last hope for the buyers. For this reason, I would recommend opening long positions there only on the condition of a false breakout. I would advise you buying GBP/USD immediately at a dip from 1.1446 or lower at the low of 2020 at 1.1402, bearing in mind an intraday correction of 30-35 pips.
What is needed to open short positions on GBP/USD
The bears did everything in their power in the first half of the day to cap the price rise above 1.16. From now on, a further trajectory will depend on the market response to the US services PMI for August. The perfect scenario will be the defense of resistance at 1.1607. The currency pair could surge there in the nearest time following the economic reports. A false breakout there will urge traders to open new short positions with a breakout of the nearest support of 1.1549 formed in the first half of the day. A breakout and the opposite test of 1.1549 upward will create the entry point for short positions in view of a drop to 1.1497 where I recommend profit-taking. I reckon this level is worth fighting for because it will be the key to a further upward correction. The more distant target is seen at 1.1446 whose test will prove the sellers' victory and the bear market. In case GBP/USD grows and the bears lack activity at 1.1607, the bulls will grasp a chance for a correction and an upward move. In this case, you should not rush to sell the pair. Only a false breakout at about 1.1685 will generate a sell signal. We could sell GBP/USD immediately at a rally from 1.1754 or higher at 1.1793, bearing in an intraday correction of 30-35 pips.

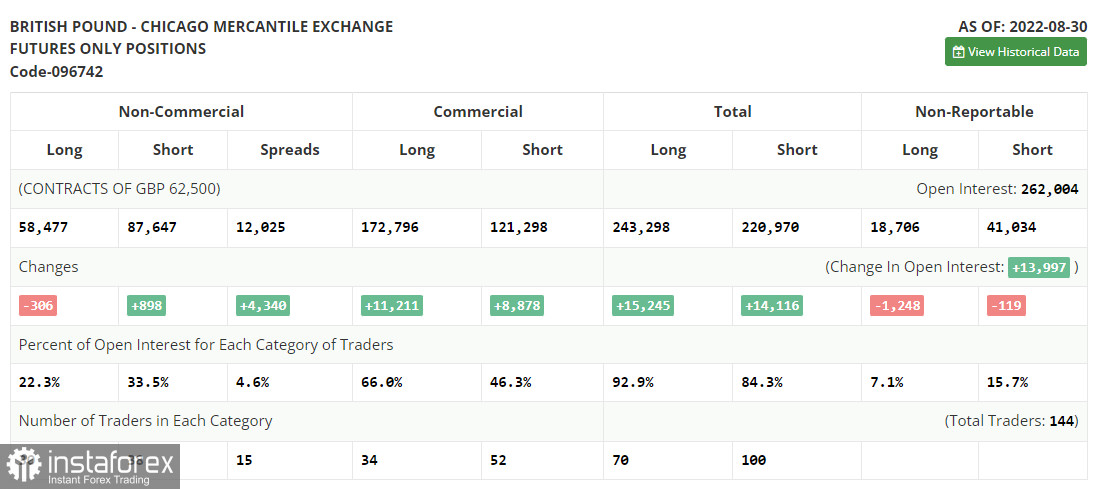
The COT (Commitment of Traders) report dated August 30 logs an increase in short positions and contraction in long positions. It proves the fact that the pound sterling is taking a nosedive. GBP/USD will remain under pressure in the future because the British economy is in dire straits. The UK GDP has been shrinking. The election of the new Prime Minister will provide the sterling with minor support because a new figure at the helm of the British government will hardly improve the economic conditions.
In turn, the US economy is still showing resilience. The latest US nonfarm payrolls assured investors that the Federal Reserve headed by Jerome Powell would proceed with aggressive monetary tightening. This will escalate pressure on the pound sterling which has been badly bruised recently. High inflation expectations and the brewing crisis of the living cost in the UK prevent traders to increase long positions. A series of weak fundamental data will follow ahead which is likely to push the sterling below the current levels. According to the last COT report, long non-commercial positions dropped by 306 to 58,477 whereas short positions grew by 898 to 86,647. This enabled a minor increase in the negative non-commercial net positions to -29,170 against -27,966. GBP/USD closed on Friday much lower at 1.1661 versus 1.1822 a week ago.

Indicators' signals:
Trading is carried out above the 30 and 50 daily moving averages. It means there is a chance for an upward correction.
Moving averages
Note: The period and prices of moving averages are considered by the author on the H1 hourly chart and differs from the general definition of the classic daily moving averages on the daily D1 chart.
Bollinger Bands
If GBP/USD grows, the indicator's upper border at 1.1625 will serve as resistance. Alternatively, if GBP weakens, the indicators' lower border at 1.1497 will serve as support.
Description of indicators
- Moving average (moving average, determines the current trend by smoothing out volatility and noise). Period 50. It is marked yellow on the chart.
- Moving average (moving average, determines the current trend by smoothing out volatility and noise). Period 30. It is marked green on the chart.
- MACD indicator (Moving Average Convergence/Divergence — convergence/divergence of moving averages) Quick EMA period 12. Slow EMA period to 26. SMA period 9
- Bollinger Bands (Bollinger Bands). Period 20
- Non-commercial speculative traders, such as individual traders, hedge funds, and large institutions that use the futures market for speculative purposes and meet certain requirements.
- Long non-commercial positions represent the total long open position of non-commercial traders.
- Short non-commercial positions represent the total short open position of non-commercial traders.
- Total non-commercial net position is the difference between short and long positions of non-commercial traders.


