


Analysis of Tuesday's deals:
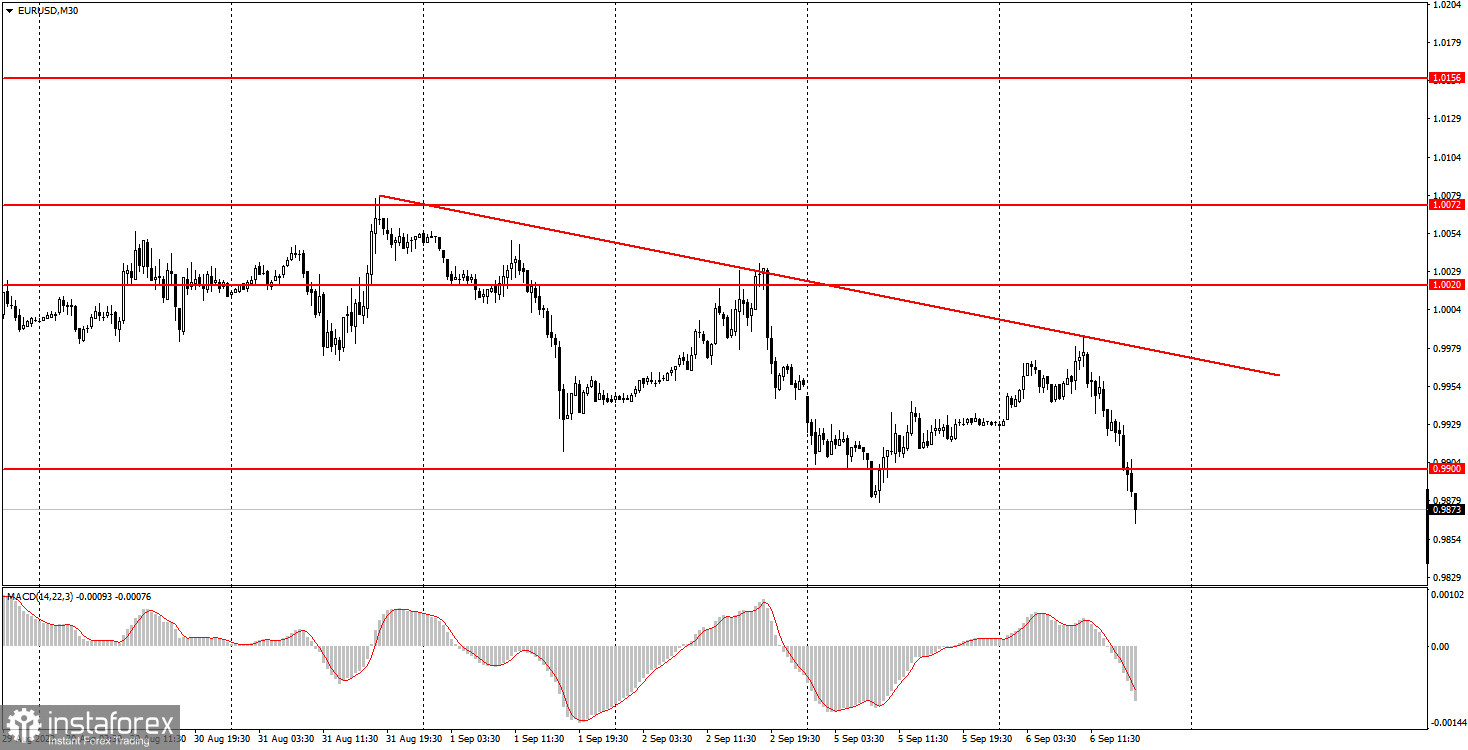
30M chart of the EUR/USD pair
5M chart of the EUR/USD pair
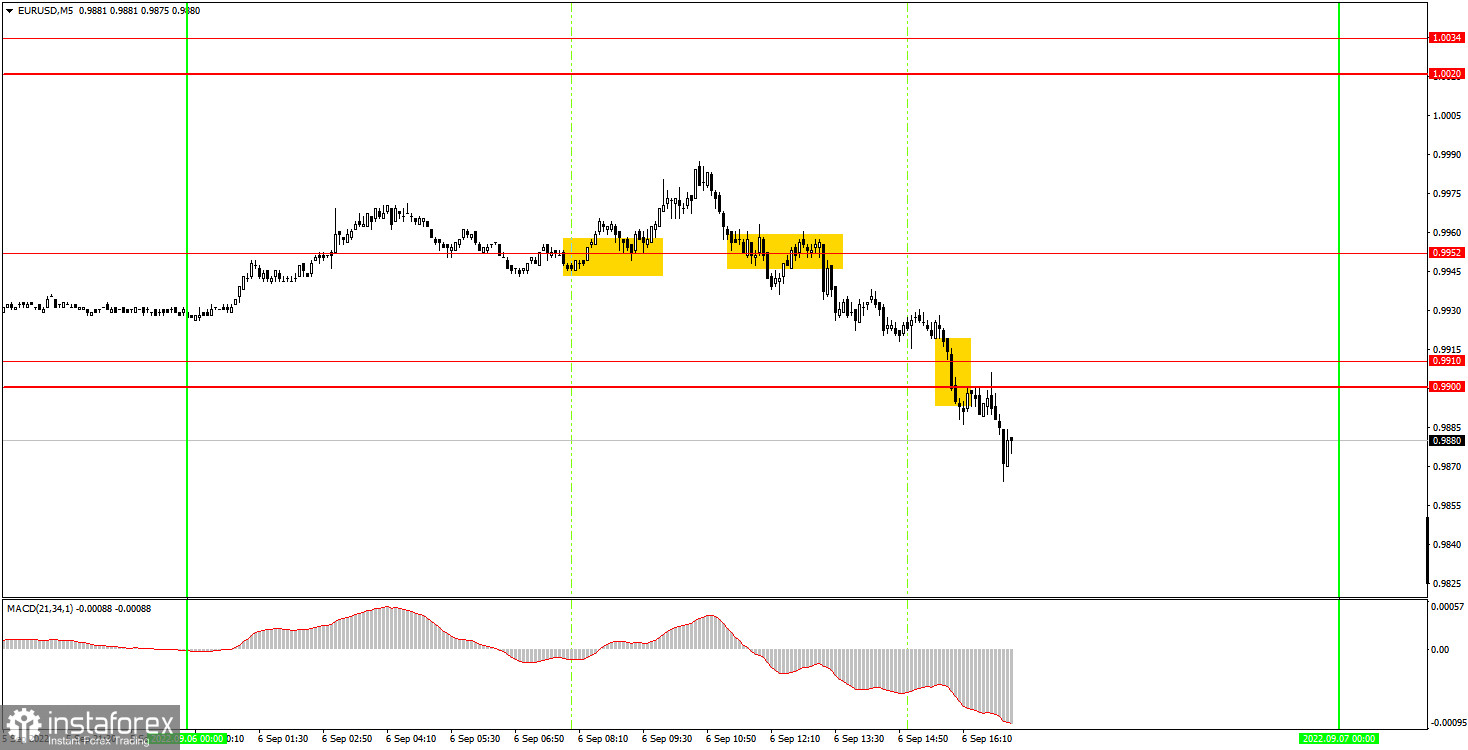
The movements on the 5-minute timeframe were more interesting. First, a buy signal was formed, after which the pair went in the right direction for 23 points. It failed to reach the nearest target level, so the signal can be considered false, but it managed to set Stop Loss to breakeven, at which the deal was closed. This was followed by a sell signal in the form of overcoming the level of 0.9952. The price did not immediately start falling, but it could not consolidate above the level of 0.9952. Subsequently, the level of 0.9900 was also overcome, so the short position should first be supported and then closed manually (a buy signal was never formed). As a result, we managed to earn about 50 points. This is a very good result.
How to trade on Wednesday:
The pair continues to gravitate toward a downward movement on the 30-minute timeframe. Despite the fact that the euro has been falling for a very long time and strongly and, undoubtedly, is very oversold, the geopolitical and fundamental backgrounds do not give traders grounds for buying it. A descending trendline also signals a downward trend. Before consolidating above this line, we would not buy the pair. On the 5-minute time frame on Wednesday it is recommended to trade at the levels (today's low), 0.9900-0.9910, 0.9952, 1.0020-1.0034, 1.0072. When passing 15 points in the right direction, you should set Stop Loss to breakeven. The EU will publish its first GDP estimate for the third quarter. From our point of view, this is a rather important report, which may be followed by a market reaction. Especially if its value will surprise traders. And in order for it to surprise, it needs to be different from the forecast, which is +0.6% Q/Q. Not a single interesting event is planned in America.
Basic rules of the trading system:
1) The signal strength is calculated by the time it took to form the signal (bounce or overcome the level). The less time it took, the stronger the signal.
2) If two or more deals were opened near a certain level based on false signals (which did not trigger Take Profit or the nearest target level), then all subsequent signals from this level should be ignored.
3) In a flat, any pair can form a lot of false signals or not form them at all. But in any case, at the first signs of a flat, it is better to stop trading.
4) Trade deals are opened in the time period between the beginning of the European session and until the middle of the US one, when all deals must be closed manually.
5) On the 30-minute TF, using signals from the MACD indicator, you can trade only if there is good volatility and a trend, which is confirmed by a trend line or a trend channel.
6) If two levels are located too close to each other (from 5 to 15 points), then they should be considered as an area of support or resistance.
On the chart:
Support and Resistance Levels are the Levels that serve as targets when buying or selling the pair. You can place Take Profit near these levels.
Red lines are the channels or trend lines that display the current trend and show in which direction it is better to trade now.
The MACD indicator (14,22,3) consists of a histogram and a signal line. When they cross, this is a signal to enter the market. It is recommended to use this indicator in combination with trend lines (channels and trend lines).
Important speeches and reports (always contained in the news calendar) can greatly influence the movement of a currency pair. Therefore, during their exit, it is recommended to trade as carefully as possible or exit the market in order to avoid a sharp price reversal against the previous movement.
Beginners on Forex should remember that not every single trade has to be profitable. The development of a clear strategy and money management are the key to success in trading over a long period of time.


