


Analysis of Tuesday's deals:
30M chart of the GBP/USD pair
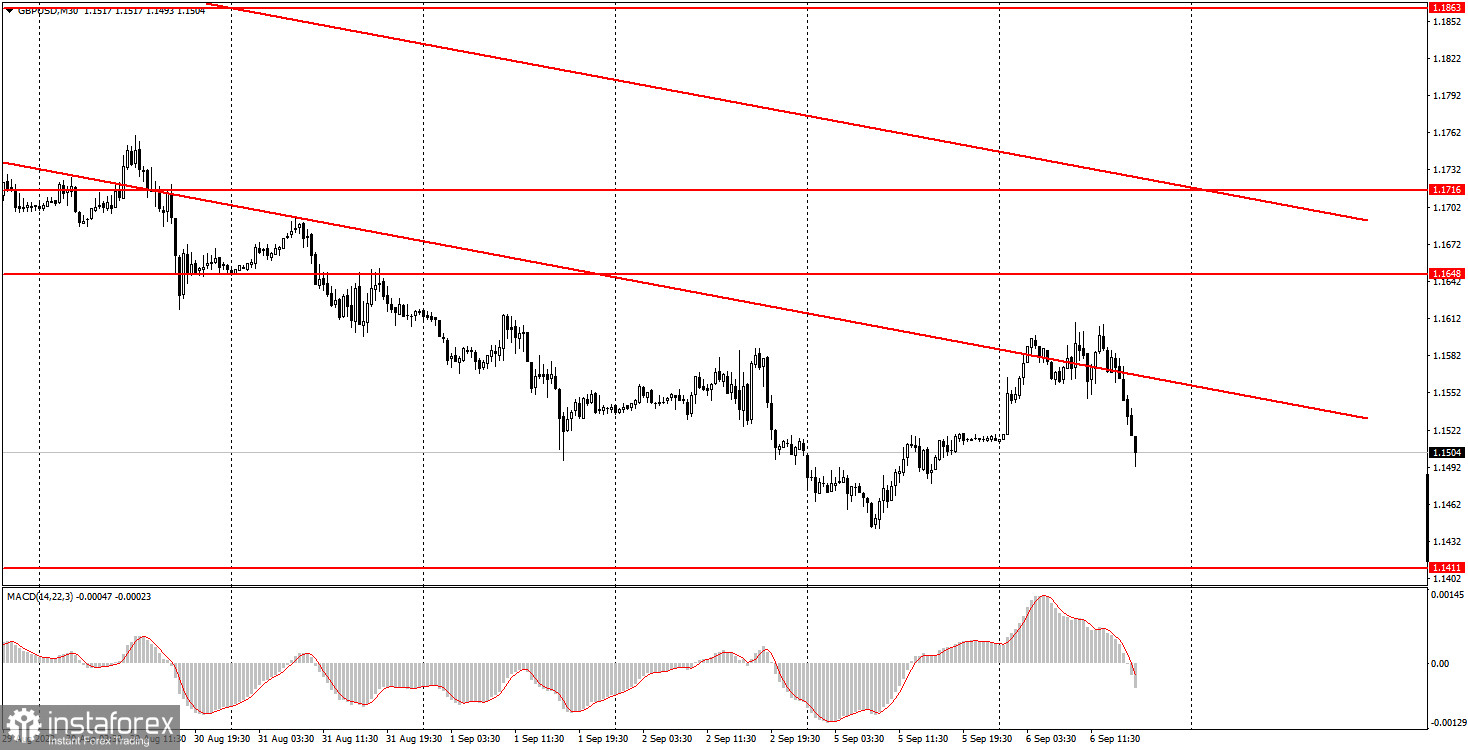
The GBP/USD pair continued to correct on Tuesday and did so at night. We believe that this behavior eloquently indicates the corrective status of the upward movement. However, no one now expects the pound to start a new upward trend. If the euro in recent weeks at least held out from a strong fall against the dollar, then the pound was absolutely not shy. You can already see the level of 1.1411 in the chart above, which is a low for the last 37 years. What are the chances that the pair, which is falling even without macroeconomic and local fundamental background, will stop 50-100 points from such an important mark? We believe that the decline will resume and continue even below this level. Moreover, now the market absolutely does not need macroeconomics or a foundation to sell the British currency. The index of business activity in the construction sector was published in the UK, which even slightly exceeded the forecast and the previous value. But, as we can see, this did not help the British pound with growth. The ISM report on business activity in the service sector was just published, and its results were surprising, as it rose to 56.9 points. At the same time, the index of business activity in the services sector S&P fell from 47.3 to 43.7 points. But by the time both reports were published, the dollar had already grown very strongly for the day.
5M chart of the GBP/USD pair
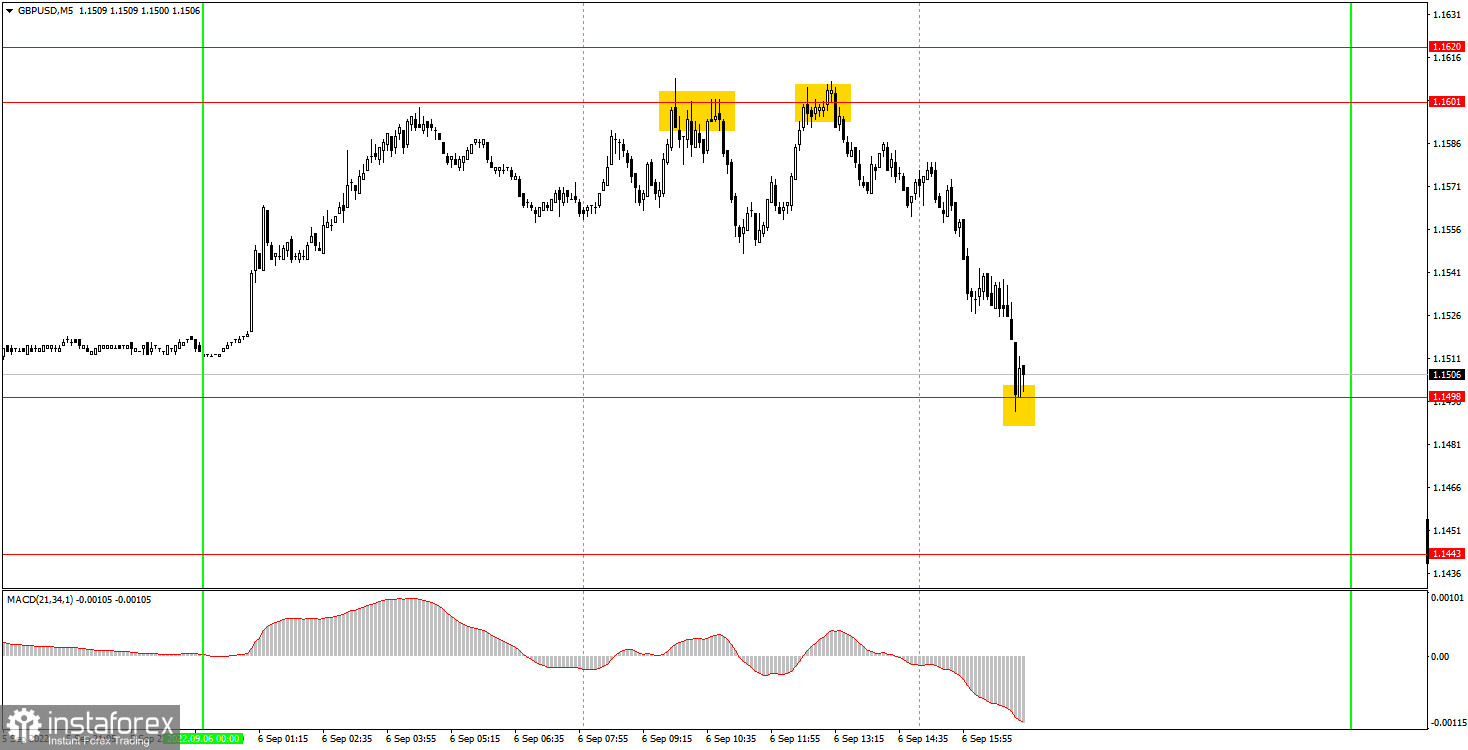
The pound/dollar pair continues to move pretty well on the 5-minute timeframe. Today the trades were very successful despite the fact that there are still very few levels in the current price area. However, the price bounced twice from the level of 1.1601 during the European trading session, thus forming two sell signals. If, after the first signal it went down only 35 points and returned to 1.1601 (the short position was closed at Stop Loss at breakeven), then after the second signal it went down 100 points and reached the level of 1.1498, rebounding from it. Thus, at this moment it was necessary to close the short positions in profit of at least 80 points. It was no longer necessary to work out the buy signal, since it was formed rather late.
How to trade on Wednesday:
The pound/dollar pair continues to follow a downward trend on the 30-minute TF. The price has already come close to its low for 37 years, so in the near future you can count on its development and breakthrough. The descending channel also remains relevant on the 30-minute TF, and the price continues to settle even below it, so there are no technical grounds for the pound's growth now. On the 5-minute TF on Wednesday, it is recommended to trade at the levels of 1.1411, 1.1498, 1.1601, 1.1620, 1.1648. When the price passes after opening a deal in the right direction for 20 points, Stop Loss should be set to breakeven. There are no major reports or other events scheduled for Wednesday in either the UK or the US. However, the market does not require macroeconomics right now. The pound goes down according to plan and is likely to continue its fall. But tomorrow there will be nothing to pay attention to novice traders.
Basic rules of the trading system:
1) The signal strength is calculated by the time it took to form the signal (bounce or overcome the level). The less time it took, the stronger the signal.
2) If two or more deals were opened near a certain level based on false signals (which did not trigger Take Profit or the nearest target level), then all subsequent signals from this level should be ignored.
3) In a flat, any pair can form a lot of false signals or not form them at all. But in any case, at the first signs of a flat, it is better to stop trading.
4) Trade deals are opened in the time period between the beginning of the European session and until the middle of the US one, when all deals must be closed manually.
5) On the 30-minute TF, using signals from the MACD indicator, you can trade only if there is good volatility and a trend, which is confirmed by a trend line or a trend channel.
6) If two levels are located too close to each other (from 5 to 15 points), then they should be considered as an area of support or resistance.
On the chart:
Support and Resistance Levels are the Levels that serve as targets when buying or selling the pair. You can place Take Profit near these levels.
Red lines are the channels or trend lines that display the current trend and show in which direction it is better to trade now.
The MACD indicator (14,22,3) consists of a histogram and a signal line. When they cross, this is a signal to enter the market. It is recommended to use this indicator in combination with trend lines (channels and trend lines).
Important speeches and reports (always contained in the news calendar) can greatly influence the movement of a currency pair. Therefore, during their exit, it is recommended to trade as carefully as possible or exit the market in order to avoid a sharp price reversal against the previous movement.
Beginners on Forex should remember that not every single trade has to be profitable. The development of a clear strategy and money management are the key to success in trading over a long period of time.


