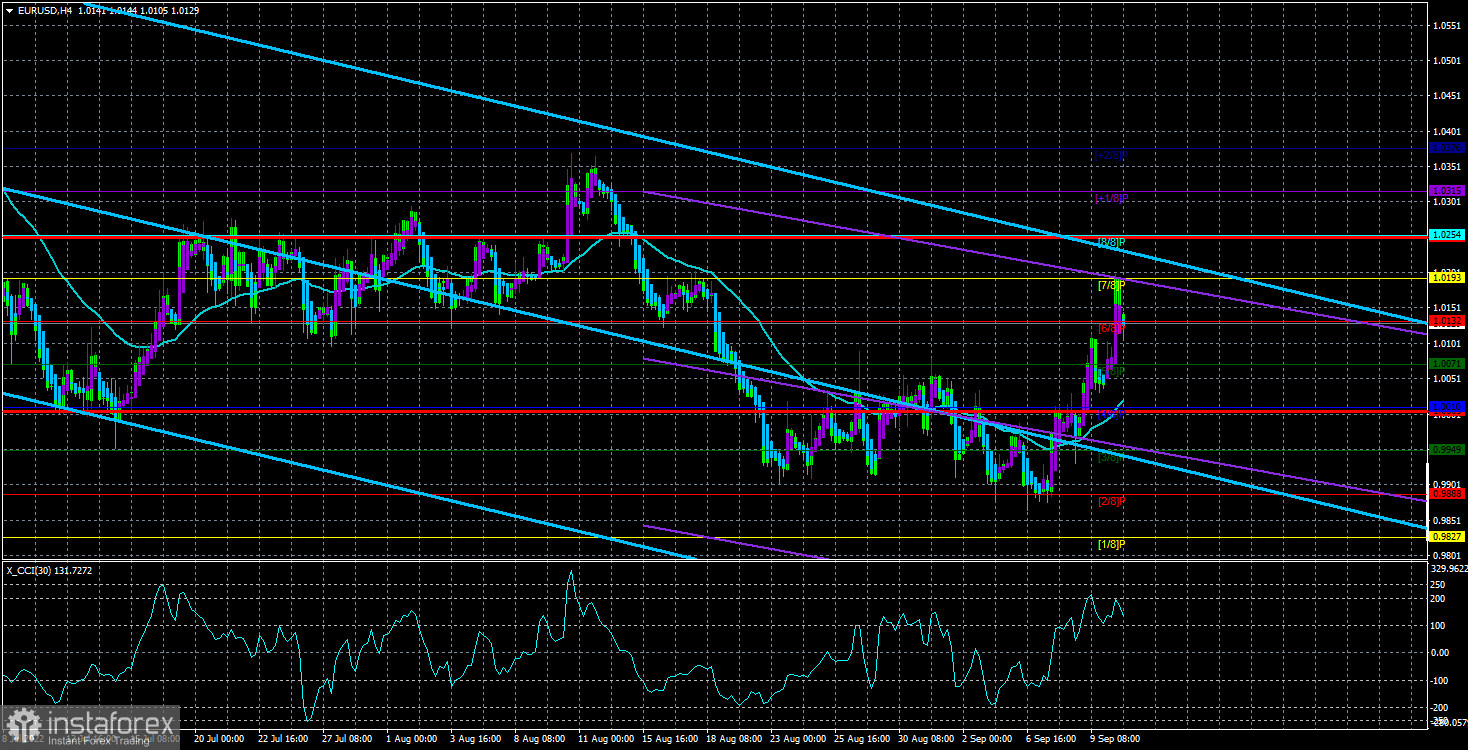
The EUR/USD currency pair grew considerably on Monday, even during the Asian and European trading sessions. That is, even theoretically, the macroeconomic background or the foundation could not affect the movement of the euro/dollar pair. Then what was it? First of all, it should be understood that nothing terrible, scary, or optimistic has happened. Currently, the European currency has moved away from its 20-year lows by 300 points. We have repeatedly said that within the framework of almost the entire downward trend of one and a half to two years, the euro was adjusted by no more than 400 points. Even now, after several days of fairly strong growth, it is still too early to talk about the end of the downward trend. Did anyone think that a downward trend is when the price drops daily? Unlikely. Thus, we believe the pair is currently in a banal technical correction. If so, then we have the last local maximum – 1.0346. If traders take the pair above it, it will be possible to talk about the possible end of the downtrend, but even in this case, nothing is guaranteed.
The fundamental background, in principle, remains the same as it was earlier, in the last 6–8 months. Yes, the ECB raised the rate for the second time and promised to continue raising it at the next meetings, but let's remember that the Bank of England is also actively raising the rate, which did not prevent the pound from updating its 37-year lows. Therefore, formally, the factor of the ECB's willingness to tighten monetary policy and return inflation to 2% is very good for the euro. Still, in practice, everything may not be so rosy. Recall that the European Union is on the verge of an energy crisis that could lead to a serious recession. No one can say now how strong and how long it will be. Whether gas supplies from Russia to the EU will be carried out in the coming years, too, no one can say. We see that even now, the European Union does not know how to reduce the prices of "blue fuel." It proposes to limit them at the legislative level, and Moscow, meanwhile, warns that in the case of a unilateral price setting, it can simply stop any supplies. It is unclear how Europe will live without Russian gas until it transfers its energy to other sources. How the European economy will feel all this time is also unclear.
The ECB's aggressiveness can help out the euro currency.
Still, we assume that the downward trend will be interrupted for a while. The ECB is now showing its readiness to continue raising the rate by 0.75% at almost all meetings in 2022, and we can only ask why the European regulator used to take such a passive position on this issue. But better late than never. When the Fed slowly begins to ease its pressure, the ECB will increase it and catch up with its American counterpart in terms of the key rate. The closer both rates are to each other; the more likely the euro will grow.
This week, inflation reports in the EU, the UK, and the USA will be published. It is hardly necessary to say again that inflation is now almost the most important report for traders. We will be able to see how consumer price indices react to the measures taken by central banks and draw certain conclusions. In the case of America, inflation may continue to slow down, but we believe that the Fed will raise its rate by 0.75% for the third time in a week. Therefore, the dollar can remain strong, stronger than the euro by two heads. In the European Union, on the contrary, it makes no sense to expect a slowdown in inflation because, as of August, the ECB has tightened monetary policy only once. Now is a very delicate moment where the main question is, "how will traders react to a change in ECB policy?" It is impossible to predict their reaction in the medium term. You can only rely on the visualization of what is happening in the market with the help of technical analysis. The price is above the moving average, so we are considering buying a pair.

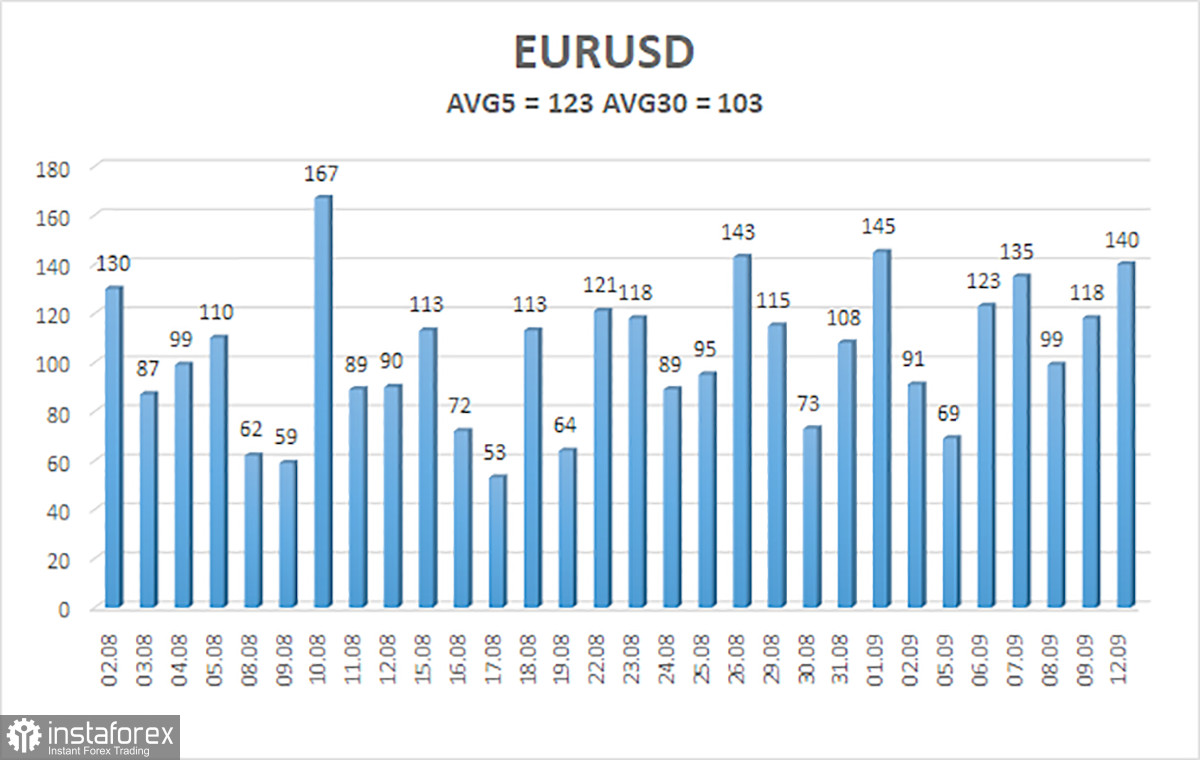
The average volatility of the euro/dollar currency pair over the last five trading days as of September 13 is 123 points and is characterized as "high." Thus, we expect the pair to move today between 1.0005 and 1.0250. The reversal of the Heiken Ashi indicator downwards signals a new round of corrective movement.
Nearest support levels:
S1 – 1.0132
S2 – 1.0071
S3 – 1.0010
Nearest resistance levels:
R1 – 1.0193
R2 – 1.0254
R3 – 1.0315
Trading Recommendations:
The EUR/USD pair may have started a new upward trend. Thus, it is now possible to stay in long positions with targets of 1.0193 and 1.0254 until the Heiken Ashi indicator turns down. It will be possible to open short positions after fixing quotes below the moving average with targets of 0.9949 and 0.9888.
Explanations of the illustrations:
Linear regression channels – help determine the current trend. If both are directed in the same direction, then the trend is strong.
Moving average line (settings 20.0, smoothed) – determines the short-term trend and the direction in which trading should be conducted now.
Murray levels are target levels for movements and corrections.
Volatility levels (red lines) are the likely price channel in which the pair will spend the next day, based on current volatility indicators.
The CCI indicator – its entry into the oversold area (below -250) or into the overbought area (above +250) means that a trend reversal in the opposite direction is approaching.


