


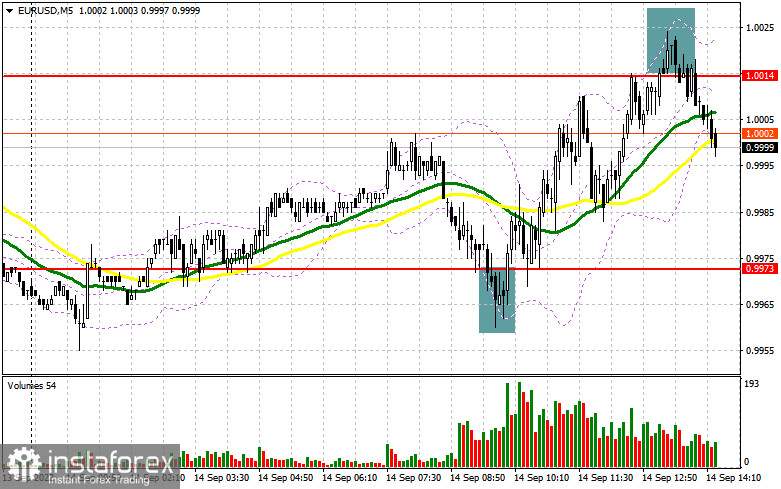
In the morning article, I turned your attention to the level of 0.9973 and recommended making decisions with this level in focus. Now, let's look at the 5-minute chart and try to figure out what actually happened. The bulls managed to defend the support level of 0.9973 in the first half of the day. It gave an excellent buy signal. The euro/dollar pair grew by more than 40 pips to 1.0014. At this level I expected the bears to assert strength. A false breakout of this level provided a sell signal. At the time of writing the article, the pair went down by more than 25 pips. The technical outlook has not changed significantly.
Conditions for opening long positions on EURUSD:
In the second half of the day, the US is going to release a crucial inflation report, which may push the euro down again. This is why it will be quite difficult for bulls to protect the morning level of 0.9973 but I still recommend trading with this level in focus. The Producer Price Index is projected to decline by 0.1% in August. However, yesterday, analysts forecast a similar drop for the Core Consumer Price Index, which eventually rose by 0.1%. As a result, the pair tumbled drastically. If everything goes like yesterday, the euro could drop to 0.9973. If so, it is better to open long positions after a false breakout. It will give a buy signal with the prospect of an upward correction to 1.0014. The pair was unable to rise above this level in the first half of the day. If the US PPI is weak, a breakout and a downward test of 1.0014 will force the bears to close their Stop Loss orders, giving an additional buy signal with the possibility of a correction to 1.0041. A more distant target will be the resistance level of 1.0079 where I recommend locking in profits. If EUR/USD declines and bulls show no activity at 0.9973, the pressure on the pair will escalate. If this scenario is correct, it would be wise to open long positions after a false breakout near the low of 0.9934. You can buy EUR/USD at a bounce from 0.9880 or a low of 0.9849, keeping in mind an upward correction of 30-35 pips.
Conditions for opening short positions on EURUSD:
Bears chose a wise strategy and did not enter the market in the first half of the day. The main task for today is to protect the nearest resistance level of 1.0014. The pair has already been unable to break through this level today. So, it moved down. If there is a false breakout, similar to the one I was analyzing above, I am prone to open short positions, betting on a further decline to 0.9973. A breakout below this level and an upward test will generate an additional sell signal. Bulls will have to close their Stop Loss orders. The pair is likely to tumble to 0.9934 where I recommend locking in profits. A further target level will be a low of 0.9880 if bulls decide not to open new long positions on the euro following the PPI index report. If EUR/USD climbs during the US session and bears show no energy at 1.0014, the pair could begin an upward correction to the next resistance level of 1.0041. If so, it is better to open short positions at 1.0041 only if a false breakout occurs. You can sell EUR/USD at a bounce from a high of 1.0079 or 1.0118, keeping in mind a downward intraday correction of 30-35 pips.
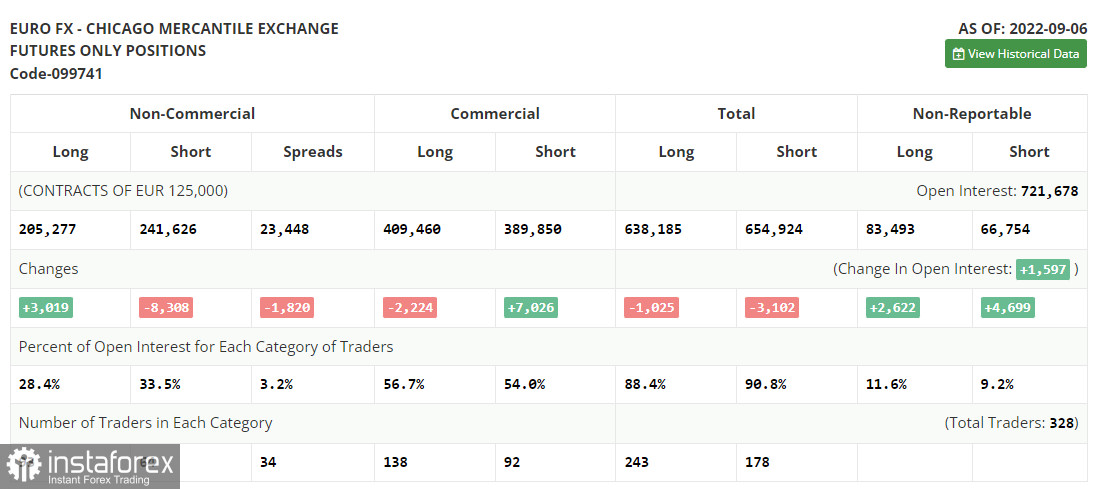
The COT report (Commitment of Traders) for September 6 logged a contraction in short positions and a sharp increase in long ones. Such changes are hardly surprising given that the report came before the ECB meeting where the regulator raised the interest rates by 0.75%. As the key rate gap between the Fed and the ECB is narrowing, demand for the European currency is gradually rising. However, it is crucial to understand that the European economy is now facing serious economic problems. The winter period is approaching. The EU is likely to deal with many unpleasant consequences due to soaring energy prices caused by gas shortages. The Fed is excepted to raise the interest rate by 0.75% next week. However, a batch of inflation reports which is due this week could somewhat impact its key rate diction. If inflation figures remain high, the central bank will definitely hike the rate aggressively. The COT report revealed that the number of long non-commercial positions increased by 3,019 to 205,277, while the number of short non-commercial positions dropped by 8,308 to 241,626. At the end of the week, the total non-commercial net position remained negative but rose slightly to -36,349 against -487,676. It indicates the first signs of an upward correction as the pair will soon bottom out. The weekly closing price declined to 0.9917 against 1.0033.
Signals of technical indicators
Moving averages
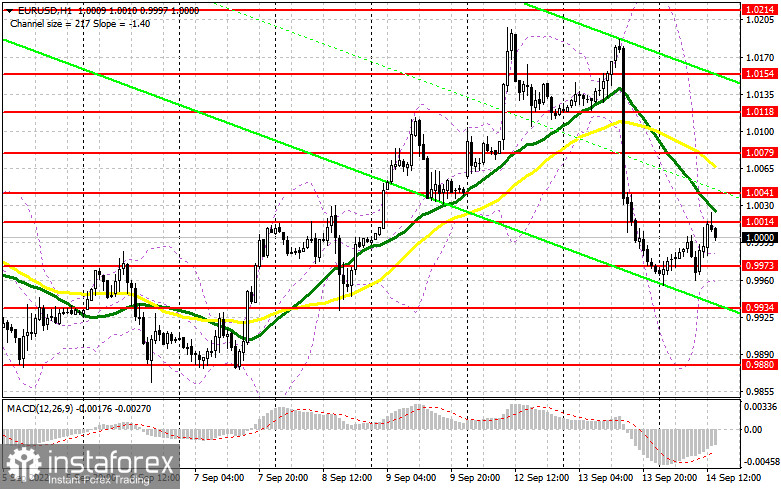
EUR/USD is trading below 30- and 50-period moving averages, signaling bearish pressure on the pair.
Remark. The author is analyzing the period and prices of moving averages on the 1-hour chart. So, it differs from the common definition of classic daily moving averages on the daily chart.
Bollinger Bands
If the EUR/USD pair moves down, the indicator's lower border at 0.9955 will act as a support level.
Definitions of technical indicators
- Moving average recognizes an ongoing trend through leveling out volatility and market noise. A 50-period moving average is plotted yellow on the chart.
- Moving average identifies an ongoing trend through leveling out volatility and market noise. A 30-period moving average is displayed as the green line.
- MACD indicator represents a relationship between two moving averages that is a ratio of Moving Average Convergence/Divergence. The MACD is calculated by subtracting the 26-period Exponential Moving Average (EMA) from the 12-period EMA. A 9-day EMA of the MACD called the "signal line".
- Bollinger Bands is a momentum indicator. The upper and lower bands are typically 2 standard deviations +/- from a 20-day simple moving average.
- Non-commercial traders - speculators such as retail traders, hedge funds, and large institutions who use the futures market for speculative purposes and meet certain requirements.
- Non-commercial long positions represent the total long open position of non-commercial traders.
- Non-commercial short positions represent the total short open position of non-commercial traders.
- The overall non-commercial net position balance is the difference between short and long positions of non-commercial traders.


