


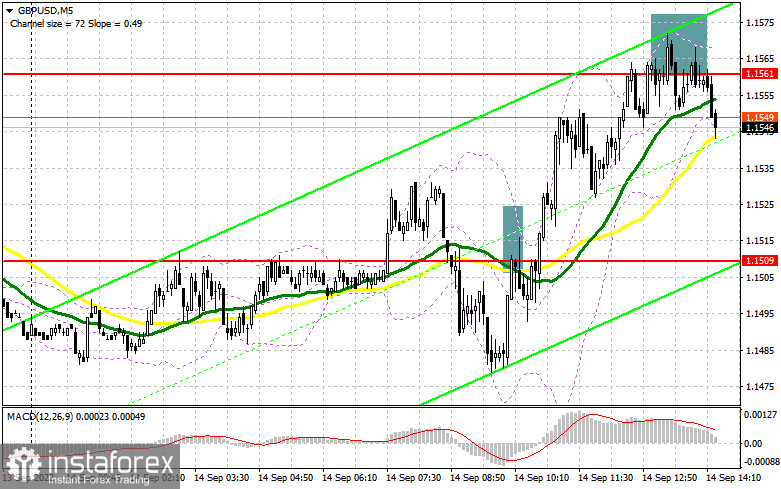
In my morning forecast, I paid attention to the level of 1.1509 and the level of 1.1561 and recommended making decisions on entering the market. Let's look at the 5-minute chart and figure out what happened. As a result of the breakout of 1.1509 and the reverse test from top to bottom, a good signal was formed in the continuation of the bear market, but alas, I did not see a further fall of the pair. After the pound rose towards the middle of the day, the bears defended 1.1561, which led to a sell signal. At the time of writing, the pair had gone down more than 25 points, and the pressure continued to increase.
To open long positions on GBP/USD, you need:
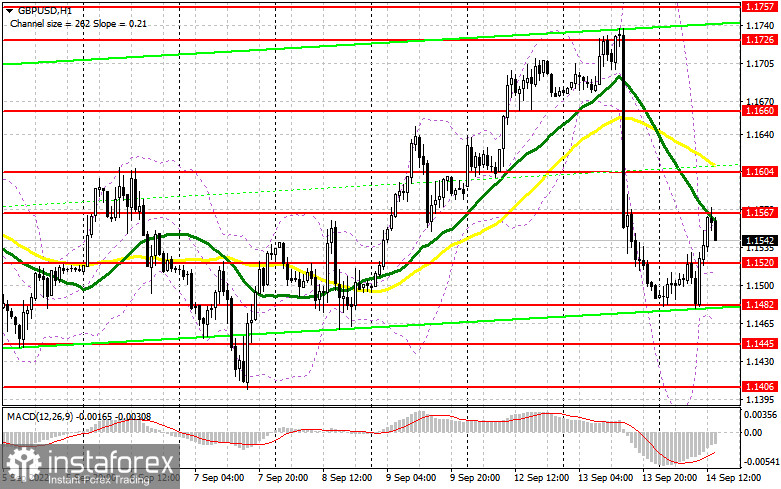
It is very important to know what the reports will be on the US producer price index and the basic producer price index, which does not take into account volatile categories. It is expected to decline, which may weaken the dollar's position and lead to a continuation of the upward correction of the pound. If everything happened as it happened yesterday, the pressure on the pair would quickly increase, which would lead to a decrease in GBP/USD to the area of the nearest support of 1.1520, formed at the end of the first half of the day. I advise you to open long positions from there only when a false breakdown is formed, and only then can you count on continued growth and an update to the maximum of 1.1567 in the area in which the moving averages are playing on the sellers' side. A breakdown and a reverse test from the top down of this range against the background of weak inflation data in the US will help strengthen buyers' confidence, opening the way to 1.1604. A more distant goal will be a maximum of 1.1660, where I recommend fixing the profits. If GBP/USD falls and there are no buyers at 1.1520, the pressure on the pair will return, as this will pull the stop orders of the morning bulls and return the downtrend to the market. Below 1.1520, only the 1.1482 area is viewed. I recommend opening long positions there only when a false breakdown is formed. You can buy GBP/USD immediately for a rebound from 1.1445 or even lower - from 1.1406 in order to correct 30-35 points within a day.
To open short positions on GBP/USD, you need:
The fall of the pound will depend entirely on the US inflation data. While trading will be conducted below 1.1567, sellers will expect further downward movement. But an equally important task will be to protect this range, having missed which buyers can cheer up and start acting more actively. Of course, the optimal scenario would be another sale on a false breakdown from the 1.1567 level. This will surely then dump GBP/USD in the area of the nearest support of 1.1520, formed during the European session. A breakout and a reverse test from the bottom up of 1.1520 will lead to an excellent sell signal with the aim of collapsing to 1.1482, where I recommend fixing the profits. A more distant target will be the 1.1445 area. With the option of GBP/USD growth and the absence of bears at 1.1567, the bulls will have a chance to develop a further correction. In this case, I advise you not to rush with sales: only a false breakdown near the maximum of 1.1604 forms a sell signal. It is possible to sell GBP/USD immediately on a rebound from the level of 1.1660, or even higher – around 1.1726, with the aim of moving down by 30-35 points within the day.
Signals of indicators:
Moving Averages
Trading is conducted below the 30 and 50-day moving averages, which indicates the likelihood of a further fall of the pair.
Note: The period and prices of moving averages are considered by the author on the hourly chart H1 and differ from the general definition of the classic daily moving averages on the daily chart D1.
Bollinger Bands
In case of a decline, the lower limit of the indicator, around 1.1470, will act as support.
Description of indicators
- Moving average (moving average determines the current trend by smoothing out volatility and noise). Period 50. The graph is marked in yellow.
- Moving average (moving average determines the current trend by smoothing out volatility and noise). Period 30. The graph is marked in green.
- MACD indicator (Moving Average Convergence / Divergence - moving average convergence/divergence) Fast EMA period 12. Slow EMA period 26. SMA period 9
- Bollinger Bands (Bollinger Bands). Period 20
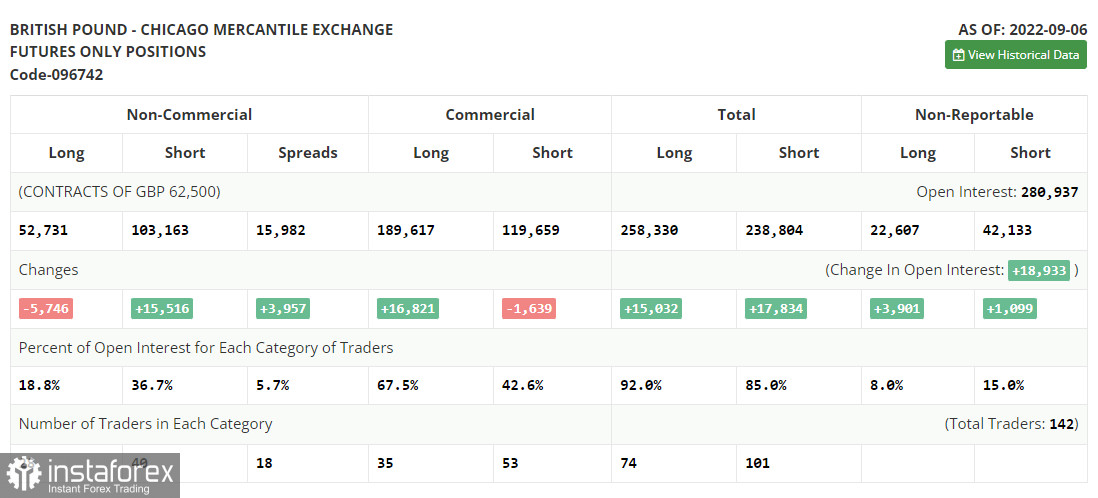
- Non-profit speculative traders, such as individual traders, hedge funds, and large institutions use the futures market for speculative purposes and to meet certain requirements.
- Long non-commercial positions represent the total long open position of non-commercial traders.
- Short non-commercial positions represent the total short open position of non-commercial traders.
- Total non-commercial net position is the difference between the short and long positions of non-commercial traders.


