


Analysis of Wednesday's deals:
30M chart of the GBP/USD pair
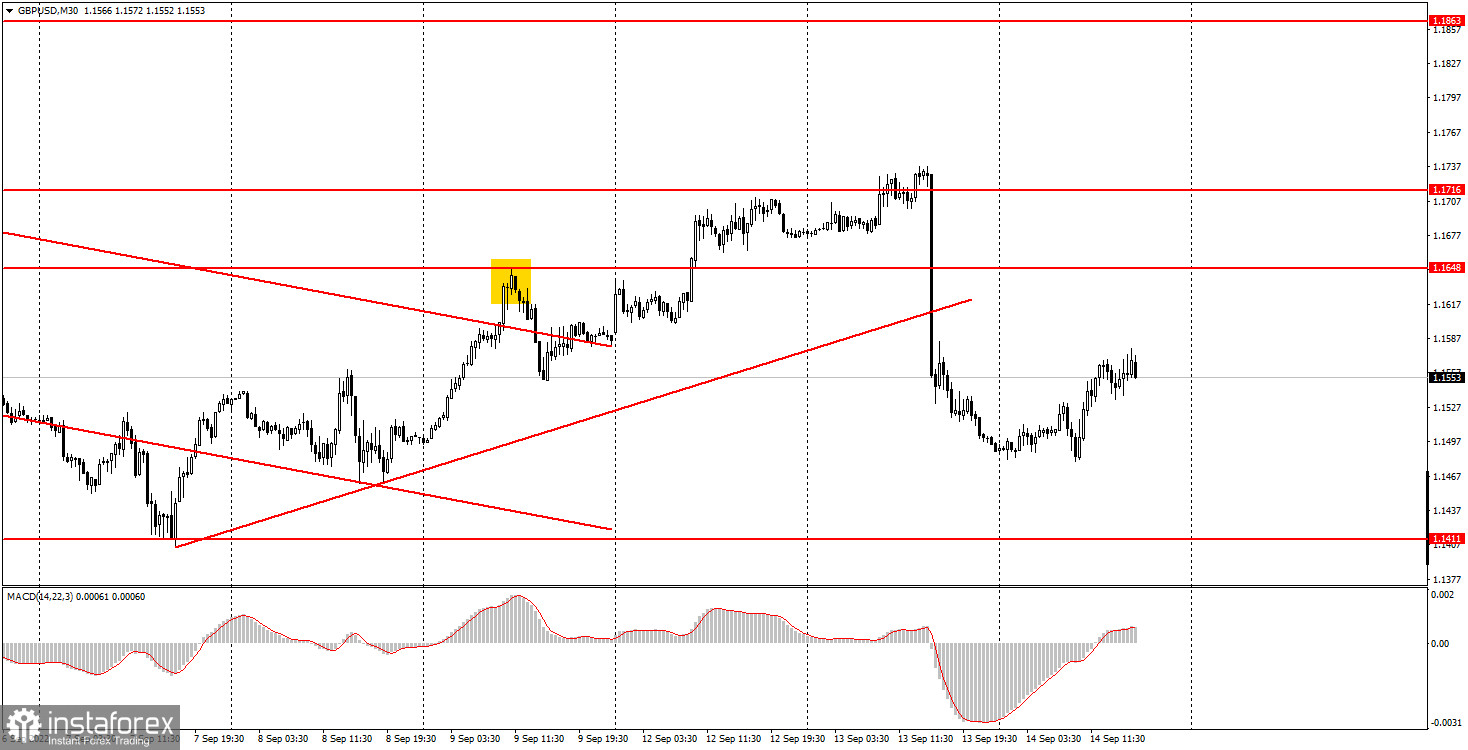
The GBP/USD pair also corrected for most of the day on Wednesday and even managed to avoid falling during the US trading session. In the UK, unlike the EU and the US, there was at least one important report. We are talking about the inflation report in August. This indicator fell rather unexpectedly to 9.9% y/y, although this decline can also be called expected, as the Bank of England raised its key rate six consecutive times, so at least a slight decrease in inflation could also be expected. But the main thing is that inflation, although it slowed down, did it by a minimum value, which does not allow us to assume that now it will decrease every month. Therefore, the BoE should continue to tighten monetary policy, but for market participants, this is also not the most important news. The market is more interested in the Federal Reserve's actions, and after the previous day's inflation report, the probability of tightening monetary policy by 0.75% for the third consecutive time rose to almost 100%. Therefore, the US dollar has every reason to continue rising. The price, of course, settled below the trend line on Tuesday, so the rate is now taken to the level of 1.1411, which is a low for 37 years.
5M chart of the GBP/USD pair
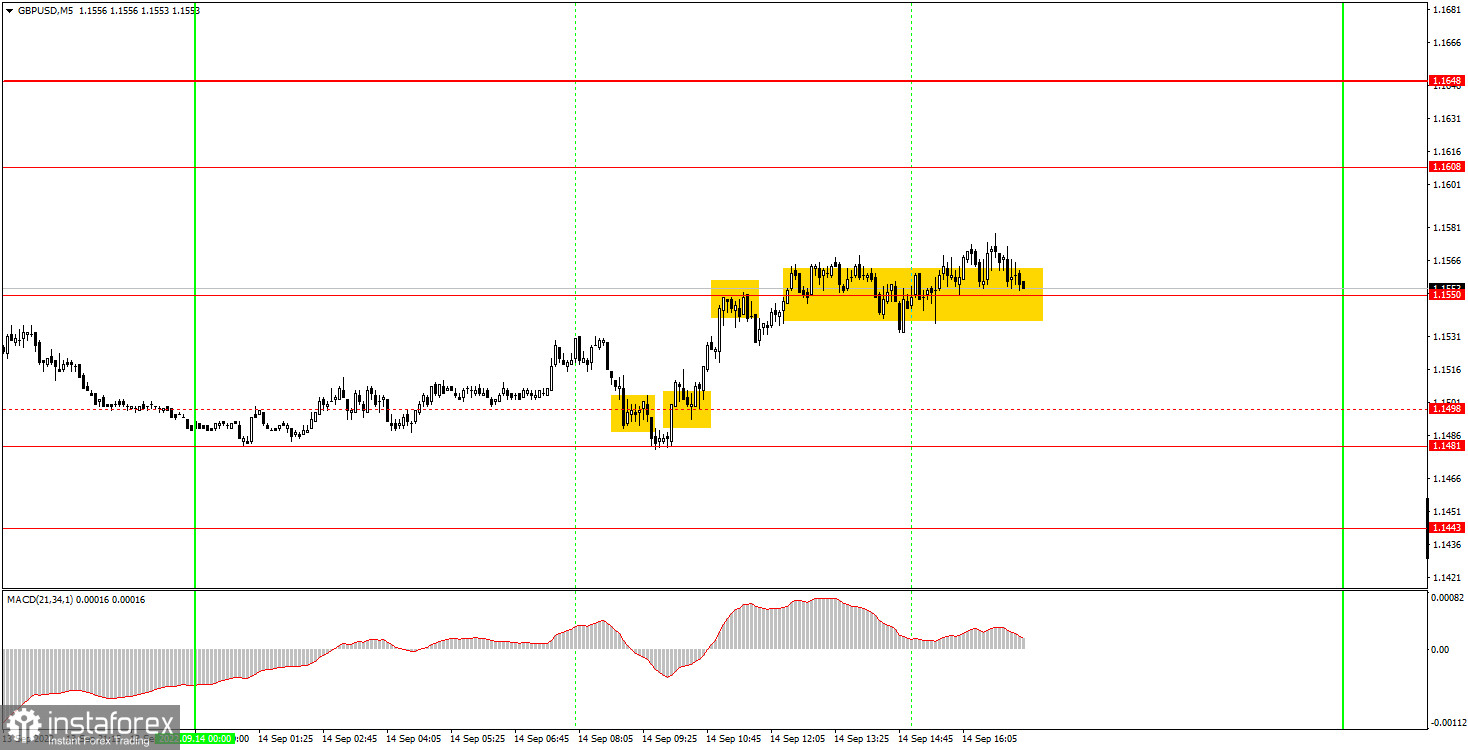
You can see on the 5-minute timeframe that the pair showed a trendy, intraday movement only for a few hours in the morning. The rest of the time it was in a blatant flat. Moreover, the pound even fell immediately after the release of the report on British inflation, but an hour later, a correctional growth probably began. In general, today's movements were rather weak. The first signal to sell - consolidating below the level of 1.1498 - turned out to be false. The price failed to go down even 20 points, so the short position closed at a loss. The next signal was slightly better – consolidating above 1.1498 and the pair managed to reach the nearest target level 1.1550, from which it rebounded. Therefore, the profit on the long position amounted to about 28 points and made it possible to cover the morning loss. However, the new sell signal also turned out to be false and again led to losses, albeit small ones. Then the pair began to "dance" around the level of 1.1550 and the flat could be seen quite easily. Therefore, novice players no longer had to open deals.
How to trade on Thursday:
The pound/dollar pair has consolidated below the rising trend line on the 30-minute time frame, so now a downward trend has formed again. The upward correction was not strong, and the euro has already resumed its fall. Thus, we believe that the pound will resume its decline. Next week we have the meetings of the Fed and the BoE, so the pair can "fly" from side to side. On the 5-minute TF on Thursday it is recommended to trade at the levels of 1.1411, 1.1443, 1.1481, 1.1550, 1.1608, 1.1648, 1.1716, 1.1755. When the price passes after opening a deal in the right direction for 20 points, Stop Loss should be set to breakeven. There is nothing interesting on the calendar of events for Thursday in the UK. Only minor reports such as retail sales, jobless claims and industrial production in America. We do not expect a strong market reaction to them.
Basic rules of the trading system:
1) The signal strength is calculated by the time it took to form the signal (bounce or overcome the level). The less time it took, the stronger the signal.
2) If two or more deals were opened near a certain level based on false signals (which did not trigger Take Profit or the nearest target level), then all subsequent signals from this level should be ignored.
3) In a flat, any pair can form a lot of false signals or not form them at all. But in any case, at the first signs of a flat, it is better to stop trading.
4) Trade deals are opened in the time period between the beginning of the European session and until the middle of the US one, when all deals must be closed manually.
5) On the 30-minute TF, using signals from the MACD indicator, you can trade only if there is good volatility and a trend, which is confirmed by a trend line or a trend channel.
6) If two levels are located too close to each other (from 5 to 15 points), then they should be considered as an area of support or resistance.
On the chart:
Support and Resistance Levels are the Levels that serve as targets when buying or selling the pair. You can place Take Profit near these levels.
Red lines are the channels or trend lines that display the current trend and show in which direction it is better to trade now.
The MACD indicator (14,22,3) consists of a histogram and a signal line. When they cross, this is a signal to enter the market. It is recommended to use this indicator in combination with trend lines (channels and trend lines).
Important speeches and reports (always contained in the news calendar) can greatly influence the movement of a currency pair. Therefore, during their exit, it is recommended to trade as carefully as possible or exit the market in order to avoid a sharp price reversal against the previous movement.
Beginners on Forex should remember that not every single trade has to be profitable. The development of a clear strategy and money management are the key to success in trading over a long period of time.


