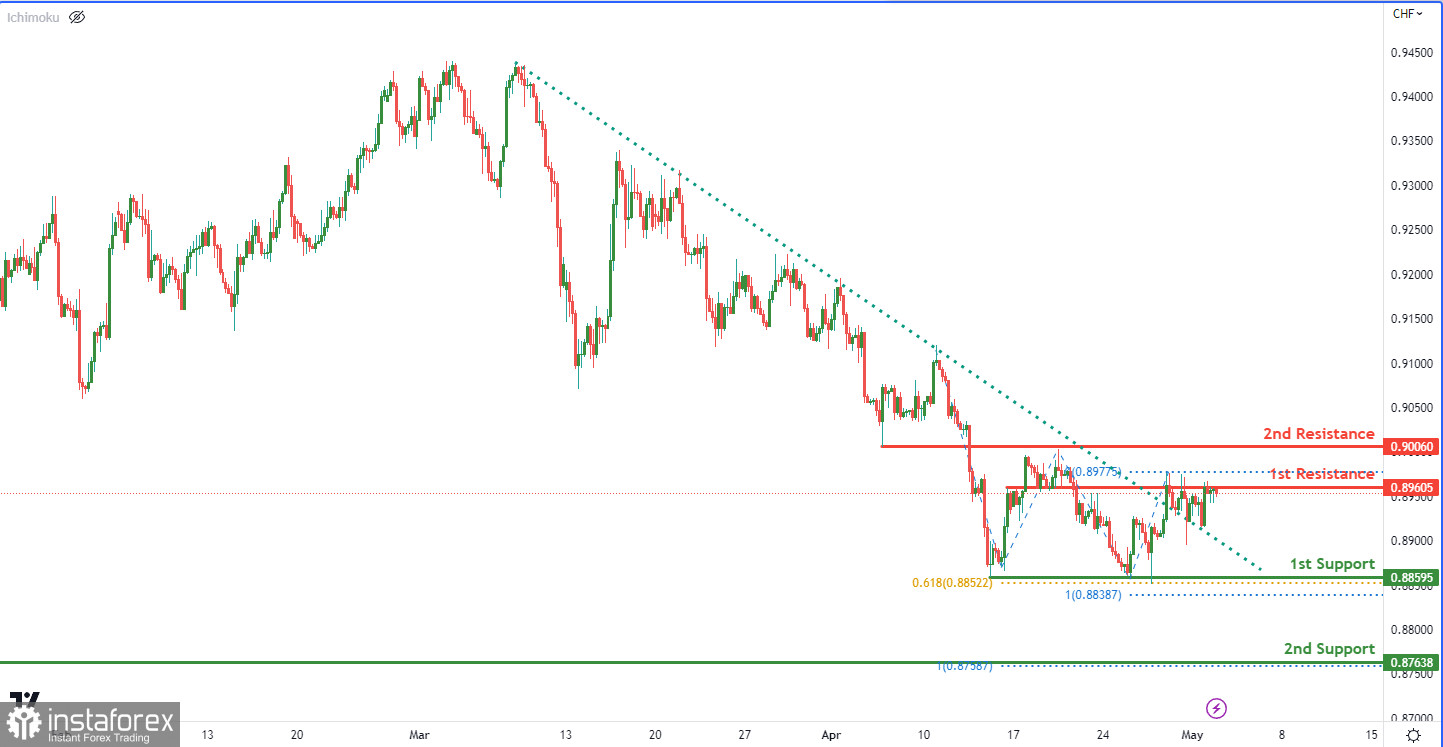
The USD/CHF chart is exhibiting a robust bullish momentum, attributed to several factors. Firstly, the price has surpassed the Ichimoku cloud, which is a bullish indication. Moreover, the price has broken a descending resistance line, suggesting a possible bullish movement.
The chart's 1st support level lies at 0.8859, which coincides with a 61.80% Fibonacci projection and is a multi-swing low support level. This level has been tested numerous times in the past and has proven to be a strong support level for the USD/CHF chart.
If the price were to fall below the 1st support level, it could potentially decline towards the 2nd support level at 0.8763. This level is also a swing low support level and has demonstrated to be a robust support level previously.
On the other hand, the 1st resistance level stands at 0.8960, which is an overlap resistance level. This level has been tried and tested several times in the past and has proven to be a formidable resistance level for the USD/CHF chart.
In case the price breaks above the 1st resistance level, it may surge towards the 2nd resistance level at 0.9006. This level is also an overlap resistance level and has established itself as a strong resistance level previously.
Overall, it's crucial to note that the USD/CHF chart is currently exhibiting strong bullish momentum, with the potential for a breakout towards the 2nd resistance level.


