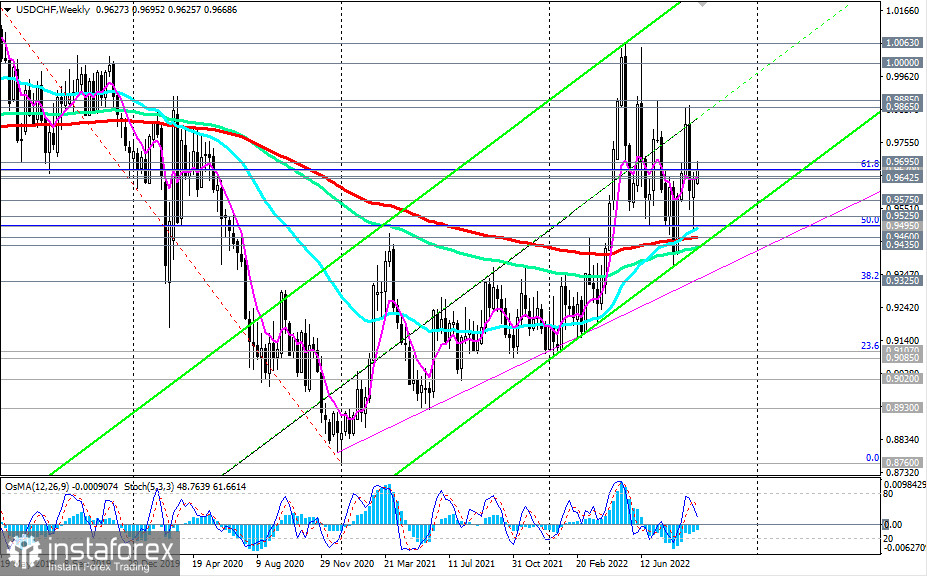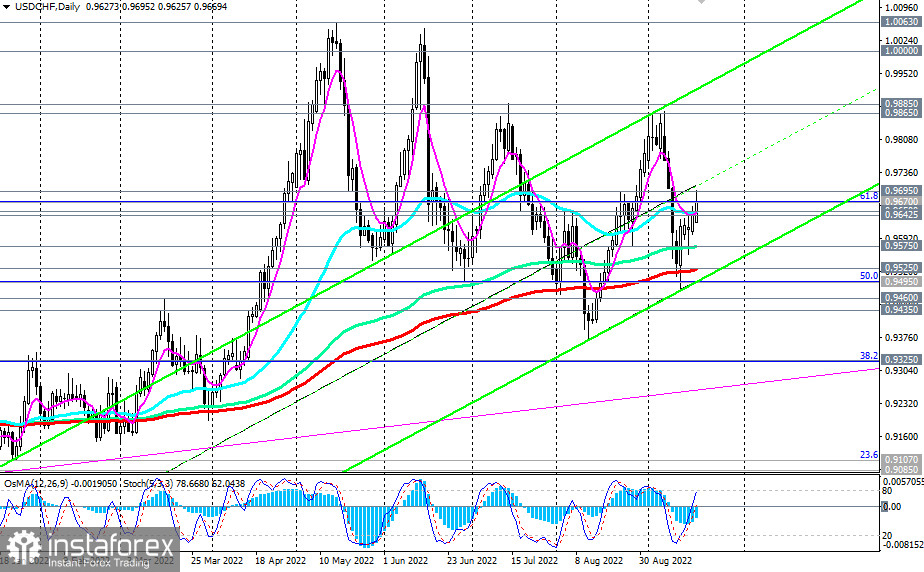
USD/CHF remains positive, trading in the bull market zone above the key support levels of 0.9460 (200 EMA on the weekly chart), 0.9525 (200 EMA on the daily chart).

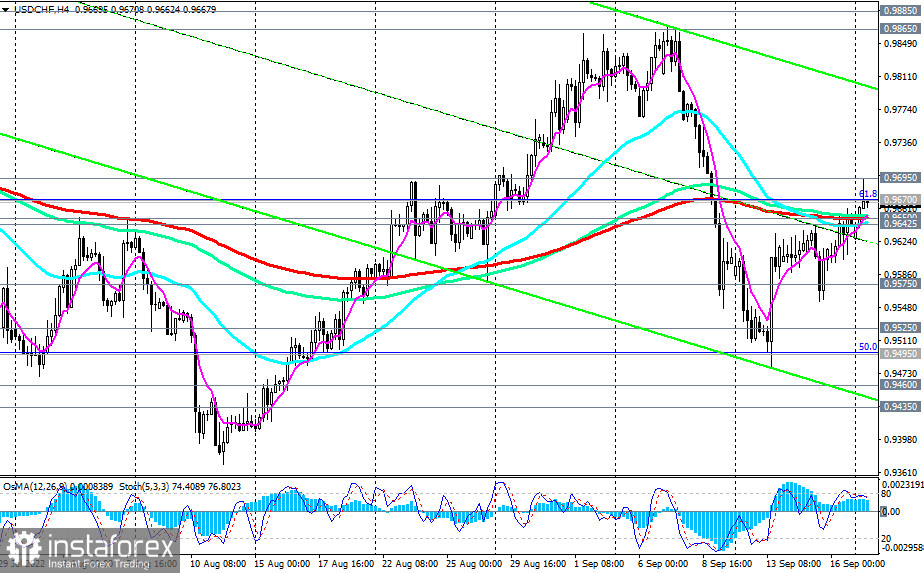
As of writing, the USD/CHF pair is trading near 0.9670, also remaining above the important short-term support levels of 0.9650 (200 EMA on the 4-hour chart), 0.9642 (200 EMA on the 1-hour chart).
Technical indicators OsMA and Stochastic on the daily chart also signal the need for long positions.

Therefore, today's high and the local resistance level of 0.9695 may become a signal of building up long positions with targets near the local resistance levels of 0.9865, 0.9885, 1.0000. Between these marks also passes the upper limit of the rising channel on the daily chart.
In an alternative scenario, the price will break through the support levels of 0.9650, 0.9642, and USD/CHF will head towards the key support levels of 0.9460, 0.9495 (50% Fibonacci upward correction to the downward wave that began in April 2019 near the 1.0235 mark), and 0.9525, separating the long-term bullish trend of the pair from the bearish one.
Support levels: 0.9650, 0.9642, 0.9575, 0.9525, 0.9495, 0.9460, 0.9435
Resistance levels: 0.9670, 0.9695, 0.9865, 0.9885, 1.0000, 1.0063
TradingTips
Sell Stop 0.9640. Stop-Loss 0.9710. Take-Profit 0.9600, 0.9575, 0.9525, 0.9495, 0.9460, 0.9435
Buy Stop 0.9710. Stop-Loss 0.9640. Take-Profit 0.9800, 0.9865, 0.9885, 1.0000, 1.0063


