


Analysis of Monday's deals:
30M chart of the EUR/USD pair
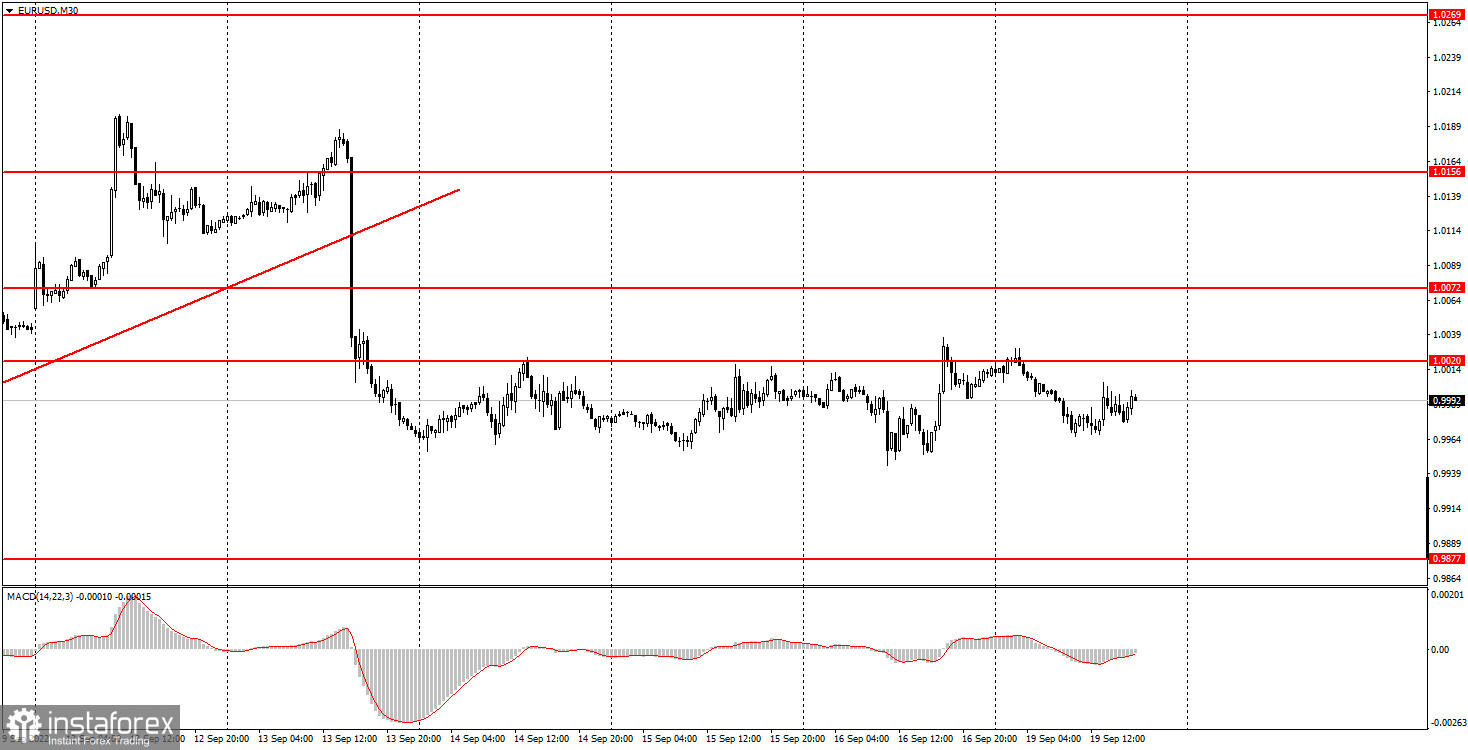
The EUR/USD currency pair traded without excesses on Monday. The movement was rather weak, the volatility amounted to a little more than 60 points. The pair remained inside the horizontal channel during the day, which we did not specifically highlight, but it is perfectly visible even without graphical aids. The price is exactly below the level of 1.0020 and cannot consolidate above it. Therefore, the technical picture in the local plan has changed to a flat, which is unlikely to last for a long time, in a longer one we have a downward trend after overcoming the ascending trend line, in an even longer one - a flat between the levels of 0.9888 and 1.0072. Do remember that the Federal Reserve will hold a meeting this week, which is expected by everyone who is related to the foreign exchange market. However, we would not like to sow panic and say that we should prepare for a movement worth 200 points, as was the case last Tuesday after the release of the US inflation report. The reaction of the market to such an important event is always difficult to predict. Volatility is likely to be high, but it does not guarantee a trend move. There were no important events either in the US or in the European Union on Monday, so very modest movements are quite understandable.
5M chart of the EUR/USD pair
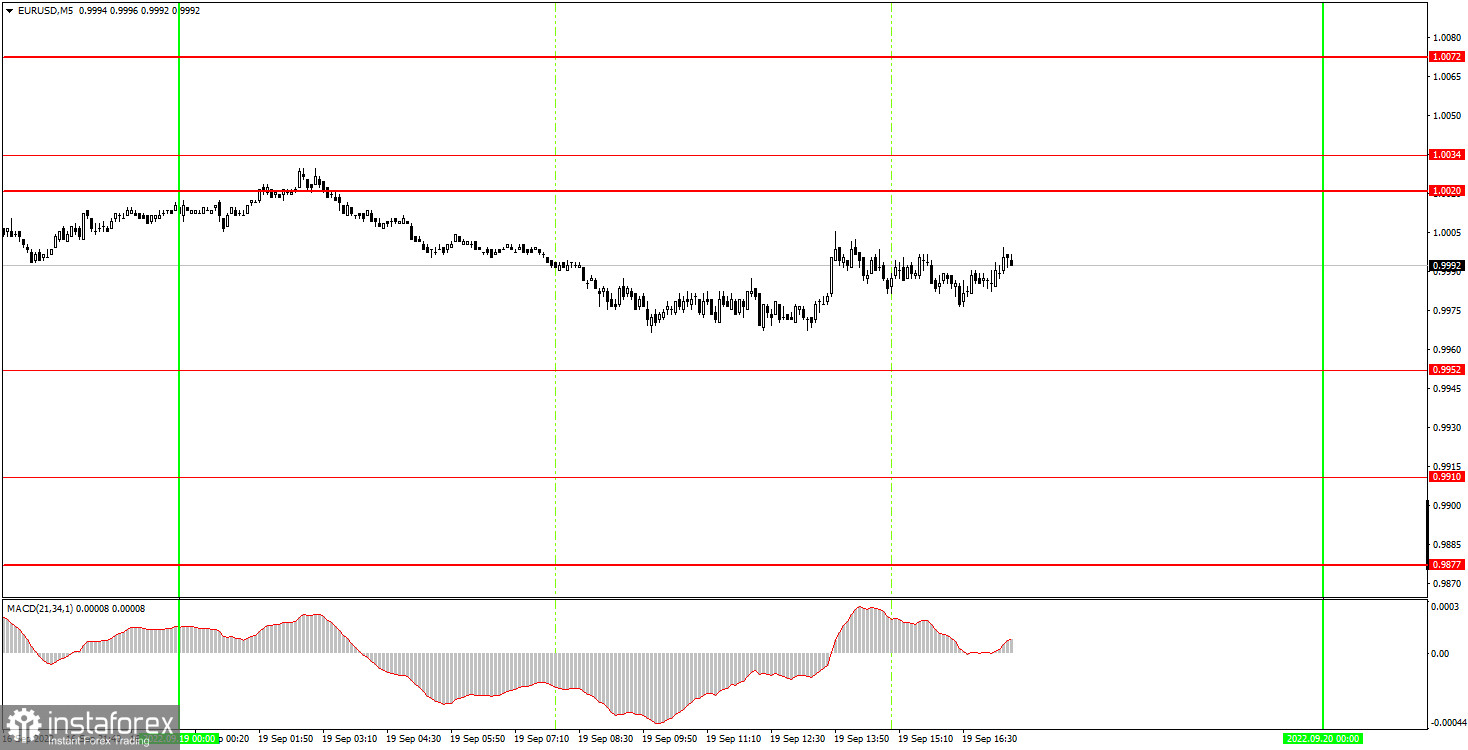
The situation with the trading signals on the 5-minute timeframe was very simple - not a single one was formed on Monday. The pair was strictly between the levels of 0.9952 and 1.0020, not even approaching either of them. Therefore, there were no signals and novice traders should not have opened positions. Recall that the pair is currently in flat, and in the first two trading days of the week, not a single important event is planned neither in the US nor in the EU. Therefore, the flat may remain until the announcement of the results of the Fed meeting on Wednesday.
How to trade on Tuesday:
The pair shows that it is ready to continue the fall on the 30-minute timeframe, but the fall itself has stalled in recent days. The pair has formed a local flat, which may stay for a couple more days. In any case, most likely, we will see the most interesting movements in the second half of the week. The downward trend continues, but the pair can move in any direction after the announcement of the results of the Fed meeting. On the 5-minute TF on Tuesday, it is recommended to trade at the levels of 0.9877, 0.9910, 0.9952, 1.0020-1.0034, 1.0072, 1.0123, 1.0156, 1.0221. When passing 15 points in the right direction, you should set Stop Loss to breakeven. The only highlight of the day will be European Central Bank President Christine Lagarde's speech. It may or may not leave its mark on the movement of the euro/dollar pair, as everything will depend on whether Lagarde will inform the markets of anything important. However, it is not recommended to ignore or forget about her speech.
Basic rules of the trading system:
1) The signal strength is calculated by the time it took to form the signal (bounce or overcome the level). The less time it took, the stronger the signal.
2) If two or more deals were opened near a certain level based on false signals (which did not trigger Take Profit or the nearest target level), then all subsequent signals from this level should be ignored.
3) In a flat, any pair can form a lot of false signals or not form them at all. But in any case, at the first signs of a flat, it is better to stop trading.
4) Trade deals are opened in the time period between the beginning of the European session and until the middle of the US one, when all deals must be closed manually.
5) On the 30-minute TF, using signals from the MACD indicator, you can trade only if there is good volatility and a trend, which is confirmed by a trend line or a trend channel.
6) If two levels are located too close to each other (from 5 to 15 points), then they should be considered as an area of support or resistance.
On the chart:
Support and Resistance Levels are the Levels that serve as targets when buying or selling the pair. You can place Take Profit near these levels.
Red lines are the channels or trend lines that display the current trend and show in which direction it is better to trade now.
The MACD indicator (14,22,3) consists of a histogram and a signal line. When they cross, this is a signal to enter the market. It is recommended to use this indicator in combination with trend lines (channels and trend lines).
Important speeches and reports (always contained in the news calendar) can greatly influence the movement of a currency pair. Therefore, during their exit, it is recommended to trade as carefully as possible or exit the market in order to avoid a sharp price reversal against the previous movement.
Beginners on Forex should remember that not every single trade has to be profitable. The development of a clear strategy and money management are the key to success in trading over a long period of time.


