


Analysis of Monday's deals:
30M chart of the GBP/USD pair
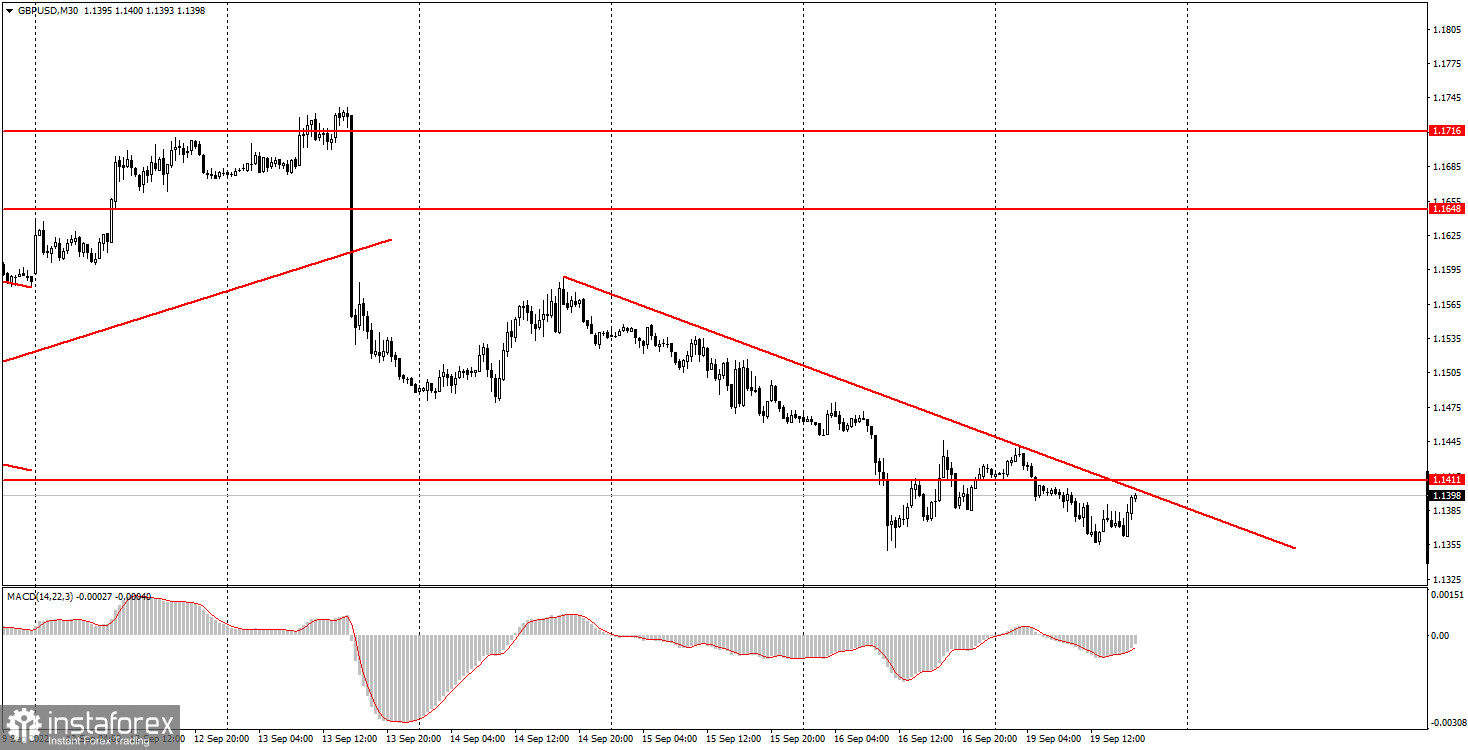
The GBP/USD pair also did not show any interesting movement on Monday. But at the same time, the pound has been falling non-stop all last week, so now it is not even close to the 37-year lows, but right on them. It was not possible to update them on Monday, although this could be expected, since the market currently does not need any reason at all to sell the pound. We have formed a very formal trend line, which only once again visualizes what is happening in the market, which is clearly visible. The trend line is formal, so consolidating above it will not mean a strong buy signal. At the same time, a rebound from it may be a signal for new short positions. It can also provoke a fall and a rebound from the level of 1.1411. There was no fundamental or macroeconomic background on Monday, but the pound does not need them now. Traders are waiting for the meetings of the Bank of England and the Federal Reserve, continuing to sell the pound. This week's movements can be very strong, so novice traders should exercise extreme caution. The concert will start on Wednesday.
5M chart of the GBP/USD pair
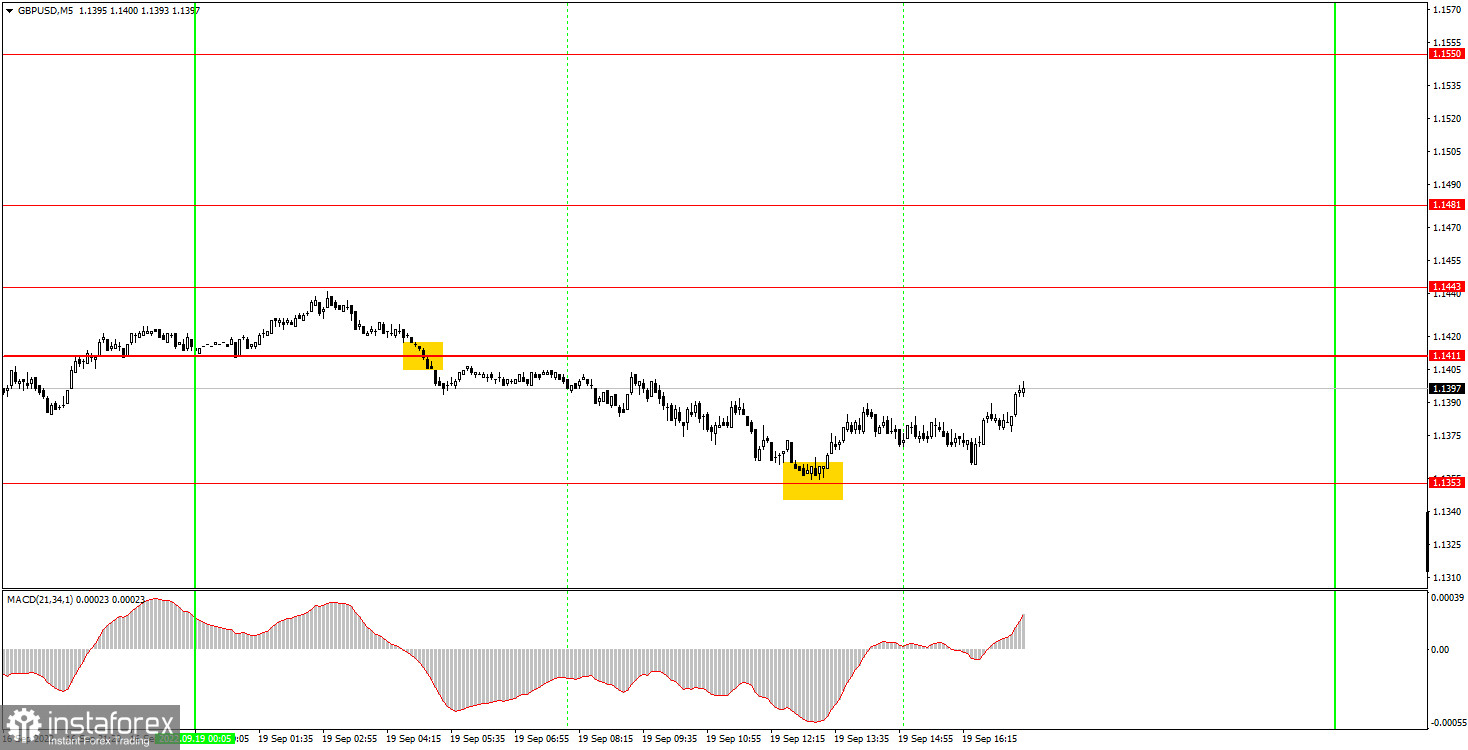
Monday's trading signals were pretty good on the 5-minute timeframe. Despite the weak volatility, two good signals were formed. The first signal to sell near the level of 1.1411 was formed at night, but at the time of the opening of the European trading session, the pair retreated very close to the formation point, so a short position could be opened. Subsequently, the price dropped to the level of 1.1353, which was the previous day's low, and bounced off it with an error of 2 points. Therefore, at this moment it was necessary to close shorts and open longs. By the middle of the US trading session, the price returned to the level of 1.1411 and completed it. Therefore, long positions should have been closed here. As a result, there were two signals in total, both trades were profitable, the total profit was about 60 points, which is not bad at all for a "boring Monday".
How to trade on Tuesday:
The pound/dollar pair continues to fall on the 30-minute TF, which is visible even without a trend line. Neither consolidation above 1.1411, nor above the trend line will mean that the pound will now turn to growth. This week there will be at least two major events, after which we can see points 200-300 below or above the current price values. On the 5-minute TF on Tuesday, it is recommended to trade at the levels of 1.1353, 1.1411, 1.1443, 1.1481, 1.1550, 1.1608. When the price passes after opening a deal in the right direction for 20 points, Stop Loss should be set to breakeven. There are no major events scheduled for Tuesday in either the UK or the US. But there will be meetings of the Fed and the BoE on Wednesday and Thursday, so we are in for a very interesting and volatile week, during which the British currency may well update its lows a couple of times over the past 37 years.
Basic rules of the trading system:
1) The signal strength is calculated by the time it took to form the signal (bounce or overcome the level). The less time it took, the stronger the signal.
2) If two or more deals were opened near a certain level based on false signals (which did not trigger Take Profit or the nearest target level), then all subsequent signals from this level should be ignored.
3) In a flat, any pair can form a lot of false signals or not form them at all. But in any case, at the first signs of a flat, it is better to stop trading.
4) Trade deals are opened in the time period between the beginning of the European session and until the middle of the US one, when all deals must be closed manually.
5) On the 30-minute TF, using signals from the MACD indicator, you can trade only if there is good volatility and a trend, which is confirmed by a trend line or a trend channel.
6) If two levels are located too close to each other (from 5 to 15 points), then they should be considered as an area of support or resistance.
On the chart:
Support and Resistance Levels are the Levels that serve as targets when buying or selling the pair. You can place Take Profit near these levels.
Red lines are the channels or trend lines that display the current trend and show in which direction it is better to trade now.
The MACD indicator (14,22,3) consists of a histogram and a signal line. When they cross, this is a signal to enter the market. It is recommended to use this indicator in combination with trend lines (channels and trend lines).
Important speeches and reports (always contained in the news calendar) can greatly influence the movement of a currency pair. Therefore, during their exit, it is recommended to trade as carefully as possible or exit the market in order to avoid a sharp price reversal against the previous movement.
Beginners on Forex should remember that not every single trade has to be profitable. The development of a clear strategy and money management are the key to success in trading over a long period of time.


