


In my morning forecast, I paid attention to the level of 1.1441 and recommended deciding on entering the market. Let's look at the 5-minute chart and figure out what happened. A false breakdown in the area of 1.1441 led to an excellent signal to sell the pound, but it never came to a major downward movement. After a short period, the bulls broke above 1.1441 and tested this level from top to bottom, which led to the closing of sales with a small loss and purchases of the pound. The upward movement was about 15 points, and buyers retreated after failing to achieve a breakdown of the weekly maximum. In the afternoon, the technical picture changed slightly.
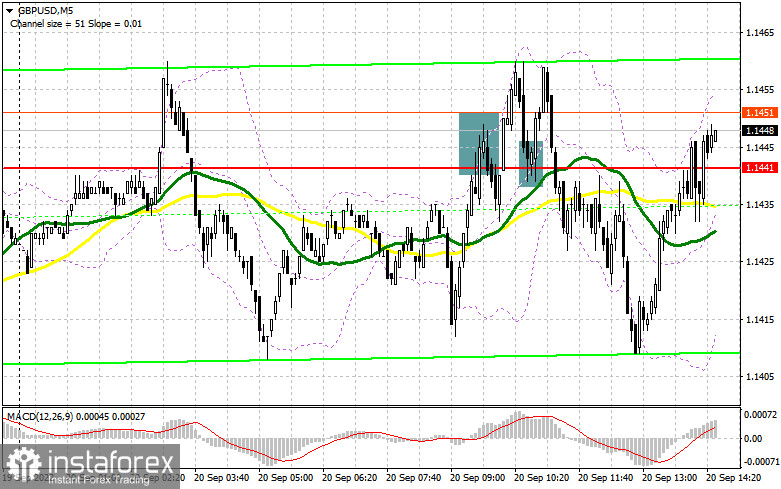
To open long positions on GBP/USD, you need:
We are waiting for data on the volume of construction permits issued and the number of new foundations laid in the United States. It may weaken the position of buyers of the US dollar, as a decrease in these indicators would be another proof that the US economy is gradually slipping into recession. It's all the fault of the continuing increase in interest rates, which we will again observe tomorrow following the results of the meeting of the money markets committee. In the case of pressure on the pair and surprisingly good statistics, the bulls will certainly try to offer something around 1.1411. I advise you to open long positions from there only when forming a false breakdown by analogy with what I discussed above. After that, it will be possible to count on the resumption of growth and on updating the maximum of 1.1457, set at the end of the first half of the day. A breakdown and a reverse test from the top down of this range against the background of weak US data will help strengthen buyers' confidence, opening the way to 1.1513. A more distant goal will be a maximum of 1.1547, where I recommend fixing the profits. If GBP/USD falls and there are no buyers at 1.1411, and there, for a moment, the moving averages pass, the pressure on the pair will return, pulling the bulls' stop orders and returning the downtrend to the market. Below 1.1411, only the 1.1366 area is viewed. I recommend opening long positions there only when a false breakdown is formed. You can buy GBP/USD immediately for a rebound from 1.1313 or even lower - from 1.1264 to correct 30-35 points within a day.
To open short positions on GBP/USD, you need:
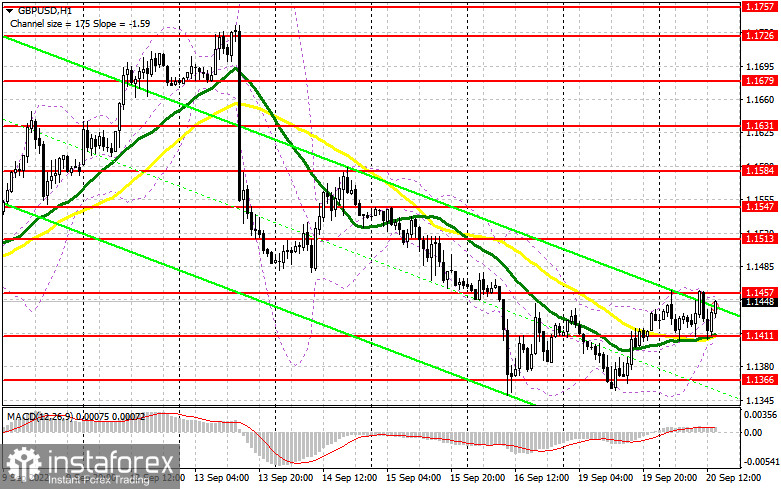
The fall of the pound will depend entirely on tomorrow's Fed meeting. For this reason, I do not expect a strong and uncontrolled downward movement of the pair in the near future. It is best to act on the growth from the upper border of the side channel in the area of 1.1457. An important task is to protect this new resistance; having missed it, buyers can cheer up and start acting more actively. The optimal scenario for selling will be a false breakdown from the 1.1457 level, which will surely dump GBP/USD in the nearest support area of 1.1411. A breakout and a reverse test from the bottom up of this range will lead to an excellent additional sell signal to collapse to an annual minimum in the area of 1.1366, where I recommend fixing the profits. A more distant target will be the 1.1313 area. With the option of GBP/USD growth and the absence of bears at 1.1457, the bulls will have a chance to develop a further upward correction. In this case, I advise you not to rush with sales: only a false breakdown near the maximum of 1.1513 forms a sell signal. It is possible to sell GBP/USD immediately on a rebound from the level of 1.1447 or even higher – around 1.1584, intending to move down by 30-35 points within the day.
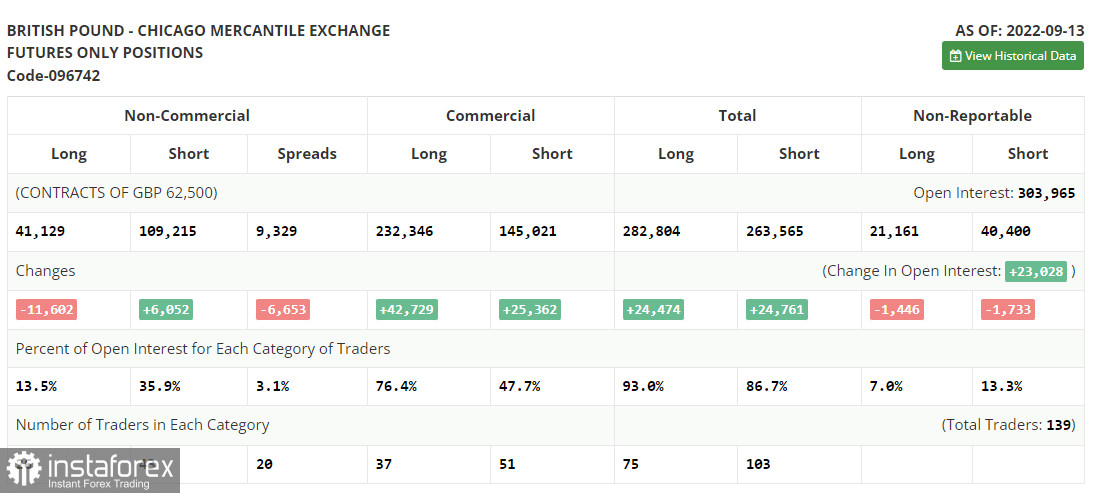
The COT report (Commitment of Traders) for September 13 recorded an increase in short positions and a reduction in long ones. This again confirms that the British pound is in a major downward peak, from which it is not as easy to get out as it might seem. This week, in addition to the meeting of the Federal Reserve System, a meeting of the Bank of England committee will also occur. A decision will be made to raise interest rates, which will negatively affect the economy, gradually slipping into recession, as evidenced by the latest macroeconomic statistics. A recent speech by the Governor of the Bank of England, Andrew Bailey, confirms the aggressiveness of the committee's intentions.
On the one hand, an increase in interest rates should support the pound. Still, on the other hand, in the face of a sharp slowdown in economic growth and a crisis in living standards in the UK, such measures force people to get rid of the British pound, betting on the US dollar as a safe-haven asset. High rates in the US also attract investors, increasing the US dollar's demand. The latest COT report indicates that long non-commercial positions decreased by 11,602 to 41,129. In contrast, short non–commercial positions increased by 6,052 to 109,215, which led to an increase in the negative value of the non–commercial net position to the level of - 68,086 versus -50,423. The weekly closing price collapsed from 1.1504 to 1.1526.
Signals of indicators:
Moving Averages
Trading is conducted around the 30 and 50-day moving averages, which indicates some market uncertainty.
Note: The period and prices of moving averages are considered by the author on the hourly chart H1 and differ from the general definition of the classic daily moving averages on the daily chart D1.
Bollinger Bands
In the event of a decline, the lower limit of the indicator, around 1.1411, will act as support. In case of growth, the upper limit of the indicator around 1.1457 will act as resistance.
Description of indicators
- Moving average (moving average determines the current trend by smoothing out volatility and noise). Period 50. The graph is marked in yellow.
- Moving average (moving average determines the current trend by smoothing out volatility and noise). Period 30. The graph is marked in green.
- MACD indicator (Moving Average Convergence / Divergence - moving average convergence/divergence) Fast EMA period 12. Slow EMA period 26. SMA period 9
- Bollinger Bands (Bollinger Bands). Period 20
- Non-profit speculative traders, such as individual traders, hedge funds, and large institutions use the futures market for speculative purposes and to meet certain requirements.
- Long non-commercial positions represent the total long open position of non-commercial traders.
- Short non-commercial positions represent the total short open position of non-commercial traders.
- Total non-commercial net position is the difference between the short and long positions of non-commercial traders.


