


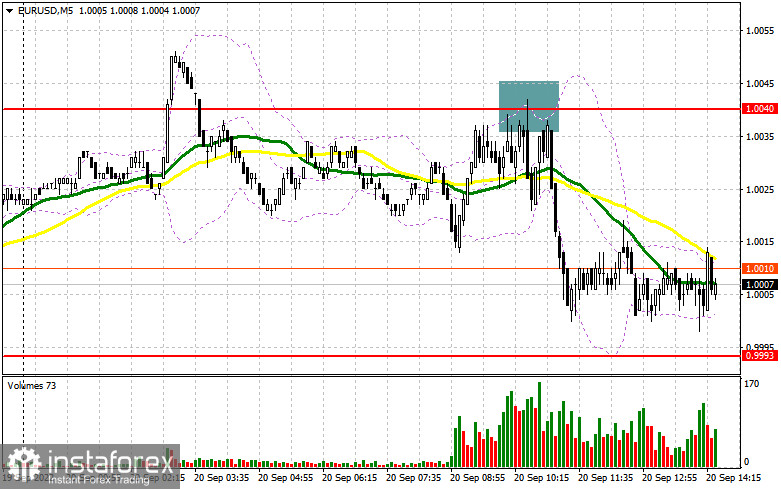
In the morning article, I turned your attention to the level of 1.0040 and recommended making decisions with this level in focus. Now, let's look at the 5-minute chart and try to figure out what actually happened. After a rise and a false breakout of 1.0040, an excellent sell signal on the euro appeared. It dropped by 40 pips. Yet, the euro did not reach the middle of the sideways channel. For the second half of the day, the technical outlook did not change.
Conditions for open long positions on EUR/USD
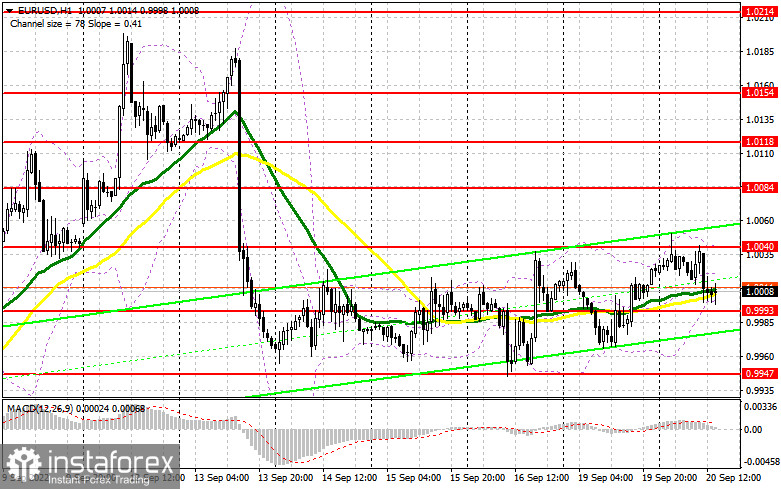
The euro did not resume growth in the morning following the release of fresh EU macro stats. It failed to consolidate above 1.0040 - the upper border of the sideways channel. During the US session, the US building permits report is due. The reading is expected to be downbeat. It may weaken the US dollar. If so, bulls could protect the nearest support level of 0.9993. Bears have been trying to push the euro below this level for a long time. Only after a false breakout of 0.9993, it is recommended to open long positions in the continuation of the uptrend. If this scenario comes true, a correction may occur to the next resistance level of 1.0040 which was formed in today's Asian session. A breakout and a downward test of this level may push the pair to a high of 1.0084. It will give an additional buy signal with the prospect of a larger upward movement to 1.0118. A more distant target will be the 1.0154 level where I recommend locking in profits. If EUR/USD declines, the US unveils positive real estate market data and bulls show no activity at 0.9993, the pair is likely to remain in the sideways channel. Bear in mind that at this level, moving averages are passing in positive territory. The price could reach 0.9947, the lower border of the sideways channel. From this level, I recommend buying only after a false breakout. You can buy EUR/USD at a bunce from a low of 0.9902 or 0.98677, keeping in mind an upward intraday correction of 30-35 pips.
Conditions for open short positions on EUR/USD
Sellers managed to retain control over the upper border of the sideways channel. As long as trading is carried out below this level, we can expect a further drop in the euro to 0.9993. It is better to open short positions after another false breakout of the nearest resistance level of 1.0040. Such a decline may take place only if the US buddings permits report turns out to be weak. A short-term rise above 1.0040, similar to the one I have mentioned above, will trigger a fall to 0.9993. At this level, bulls and bears are likely to tussle for parity level again. A breakout below this level as well as an upward test will provide an additional sell signal. It will force bulls to close Stop Loss orders. The euro could sink to 0.9947 where I recommend locking in profits. The price will hardly tumble below this level ahead of the Fed meeting. However, if it happens, the next support level will be located at 0.9902. If EUR/USD advances during the American session and bears show no energy at 1.0040, the pair could grow sharply. In this case, I advise you to postpone short positions until a false breakout of 1.0084. You can sell EUR/USD at a bounce from a high of 1.0118 or 1.0154, keeping in mind a downward intraday correction of 30-35 pips.
COT report:
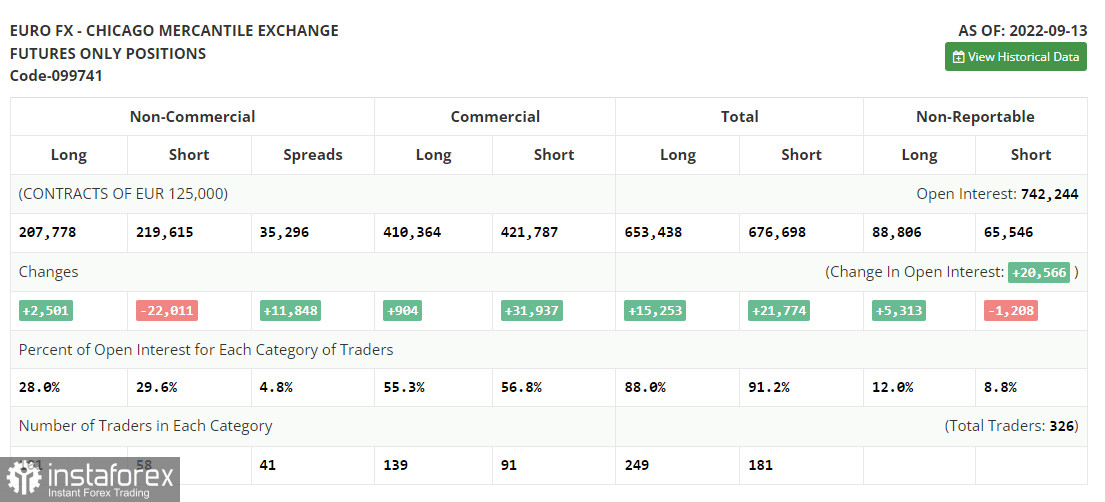
The COT report (Commitment of Traders) for September 13 logged a drop in short positions and a minor increase in long ones. Apparently, traders rushed to close positions at the current levels following the ECB meeting and a sharp key rate increase of 0.75%. They locked in profits even despite the approaching FOMC meeting. The Fed is widely excepted to raise the interest rate by at least 0.75%. However, there are rumors that the central bank could hike the benchmark rate by 100 basis points. If so, bears will take the upper hand. The euro is likely to tumble significantly versus the US dollar. Taking into account the inflation report for August, such a likelihood is extremely high. However, the European Central Bank is also no longer sitting on the sidelines. It sticks to aggressive tightening, narrowing the key rate gap with the Fed. It may help the euro in the long term. Besides, risk sentiment is likely to improve as well. The COT report revealed that the number of long non-commercial positions climbed by 2,501 to 207,778, while the number of short non-commercial positions declined by 22,011 to 219,615. At the end of the week, the total non-commercial net position remained negative but rose slightly to -11,832 from -36,349. It indicates the continuation of the upward correction and traders' attempt to find out the bottom. The weekly closing price advanced to 0.9980 against 0.9917.
Signals of technical indicators
Moving averages
EUR/USD is trading near 30- and 50-period moving averages, signaling market uncertainty.
Remark. The author is analyzing the period and prices of moving averages on the 1-hour chart. So, it differs from the common definition of classic daily moving averages on the daily chart.
Bollinger Bands
If EUR/USD moves down, the indicator's lower border at 0.9993 will serve as support. If the pair rises, the indicator's upper border at 1.0040 will act as resistance.
Definitions of technical indicators
- Moving average recognizes an ongoing trend through leveling out volatility and market noise. A 50-period moving average is plotted yellow on the chart.
- Moving average identifies an ongoing trend through leveling out volatility and market noise. A 30-period moving average is displayed as the green line.
- MACD indicator represents a relationship between two moving averages that is a ratio of Moving Average Convergence/Divergence. The MACD is calculated by subtracting the 26-period Exponential Moving Average (EMA) from the 12-period EMA. A 9-day EMA of the MACD called the "signal line".
- Bollinger Bands is a momentum indicator. The upper and lower bands are typically 2 standard deviations +/- from a 20-day simple moving average.
- Non-commercial traders - speculators such as retail traders, hedge funds, and large institutions who use the futures market for speculative purposes and meet certain requirements.
- Non-commercial long positions represent the total long open position of non-commercial traders.
- Non-commercial short positions represent the total short open position of non-commercial traders.
- The overall non-commercial net position balance is the difference between short and long positions of non-commercial traders.


