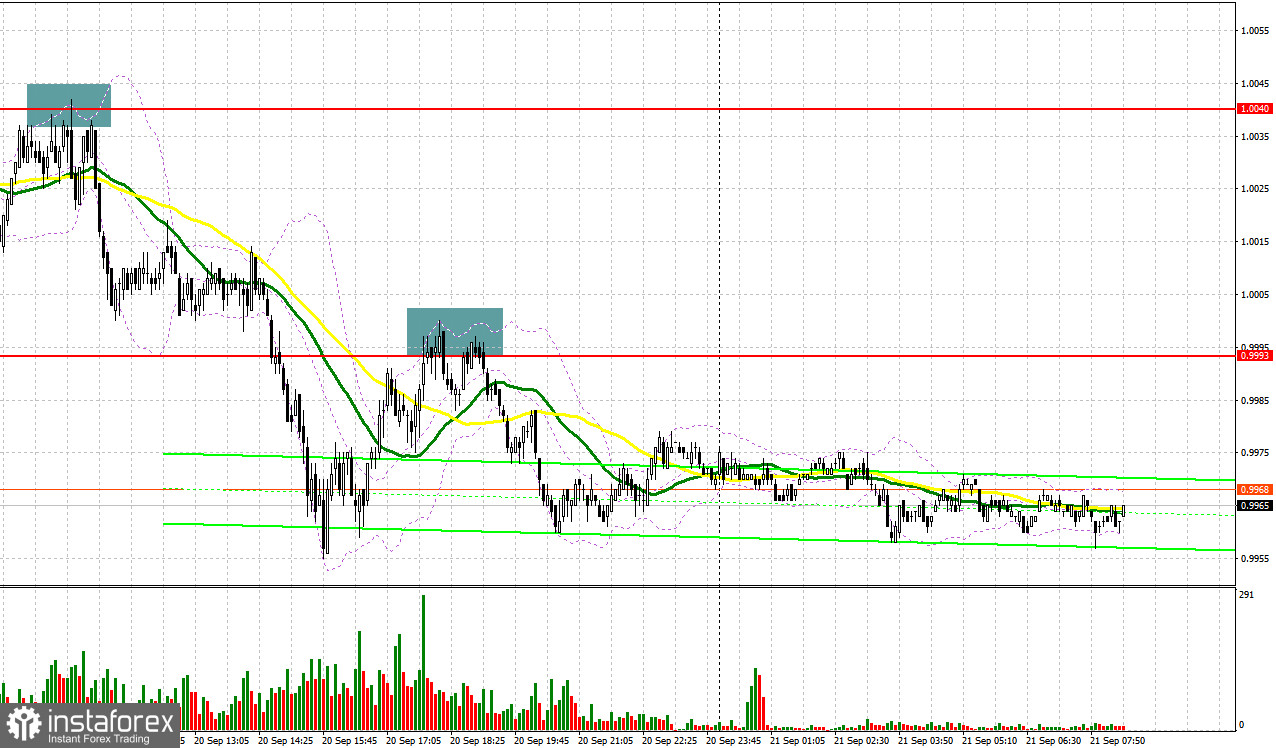
Yesterday, traders received several good signals to enter the market. Let us take a look at the 5-minute chart to figure out what happened. Earlier, I asked you to pay attention to the level of 1.0040 to decide when to enter the market. Since the pair increased and formed a false breakout of 1.0040, traders received a perfect sell signal. The pair dropped by about 40 pips without reaching the middle line of the sideways channel. In the second part of the day, a breakout and a test of 0.9993 led to another sell signal. As a result, the pair lost another 30 pips.

Conditions for opening long positions on EUR/USD:
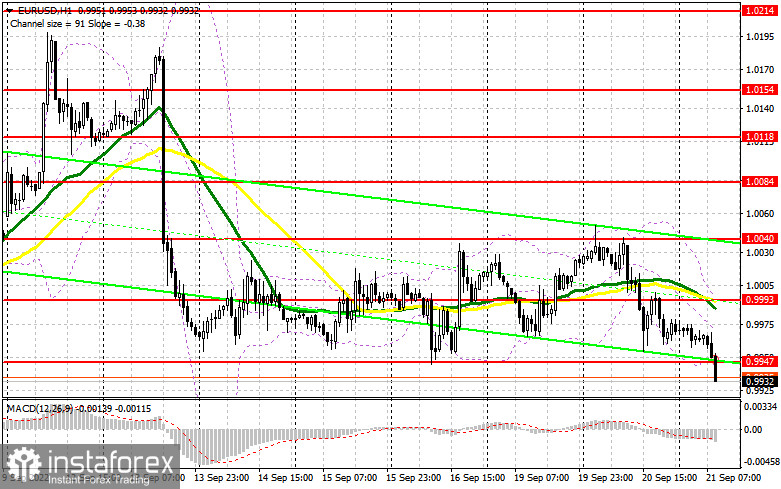
Today, in the first part of the day, the eurozone will not publish any statistical report. What is more, comments that will be provided by the ECB's representatives will hardly affect the pair's future trend. Everything depends on the Fed's decision on the key interest rate. As expected, the regulator will raise interest rates by just 0.75%. Traders have already priced in such an outcome. Notably, most economists, who at the beginning of the week, anticipated a rise of 1.0%, now suppose that this scenario is hardly possible. The Fed's economic forecasts are of vital importance. Politicians are expected to hint about the magnitude of the interest rate hike and how long they are planning to hold rates at high levels. This information will determine a mid-term trend in the market. If the euro declines, buyers will become active at the lower limit of the sideways channel located at 1.9947. It will be better to wait for a false breakout of this support level, which will give an entry point with the target at 0.9993. If the Federal Reserve provides dovish announcements, the euro may rise. A breakout and a downward test of 0.9993 may affect bears' stop orders, thus forming an additional long signal with the target at 1.0040. The next target is located at the support level of 1.0084, where it is recommended to lock in profits. If the euro/dollar pair declines and buyers fail to protect 0.9947, pressure on the pair will increase. In this case, the bearish trend will gain momentum. Thus, it will be wise to go long after a false breakout of the low of 0.9902. Traders may also open buy orders just after a bounce off 0.9867 or even lower – at 0.9819, expecting a rise of 30-35 pips.
Conditions for opening short positions in EUR/USD:
Bears are controlling the market. The longer the pair is trading below 1.0000, the more likely it will fall deeper to new lows, especially amid the interest rate hike by the Fed. It means that buyers should protect the middle level of the sideways channel located at 0.9993. The pair may test this level in the first part of the day just after the ECB's representatives provide their speeches. Big traders may start entering the market at the level of 0.9993. In case of a false breakout, it will be possible to go short with the target at 0.9947. A breakout, settlement below this level, and an upward test will give an additional sell signal. In the event of this, the pair may slump to the lower limit of the sideways channel located at 0.9902, where it is recommended to lock in profits. The next target is located at a low of 0.9867. If the euro/dollar pair jumps during the European session and bears fail to protect 0.9993, demand for the euro will mount. However, the situation is unlikely to change dramatically since everyone will be waiting for the Fed's reaction to the recent inflation figures. The upward correction may allow the pair to climb to the next resistance level of 1.0040. Under these conditions, traders should go short at 1.0040 after a false breakout. They may also sell the asset just after a bounce off 1.0084 or higher – at 1.0118, expecting a decline of 30-35 pips.
COT report
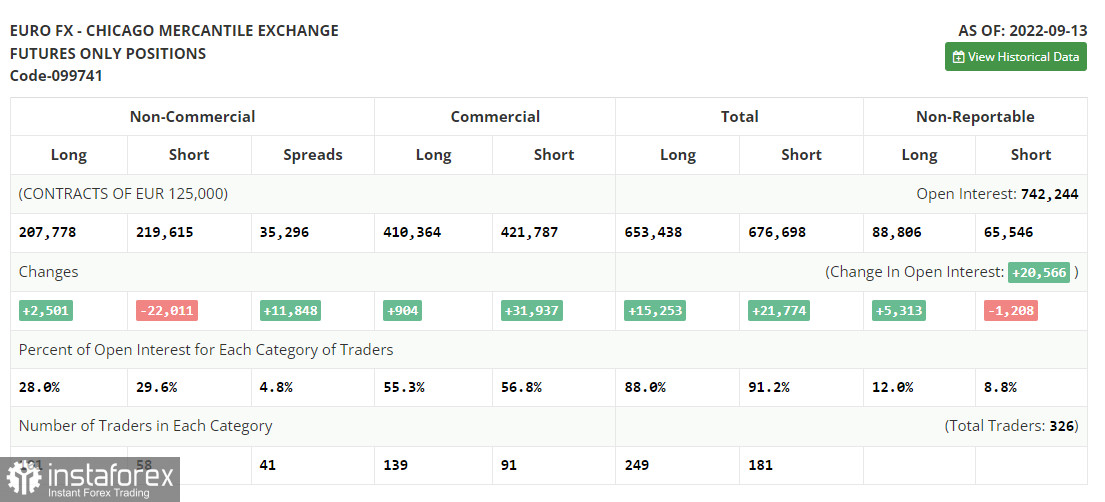
According to the COT report from September 13, the number of short positions dropped, whereas the number of long positions slightly increased. Apparently, traders rushed to close positions at the current levels following the ECB meeting and a sharp rise in the key interest rate of 0.75%. They locked in profits, ignoring the approaching FOMC meeting. The Fed is widely expected to raise the interest rate by at least 0.75%. However, there are rumors that the regulator could hike the benchmark rate by 100 basis points. If the predictions come true, bears will take the upper hand. The euro is likely to tumble against the US dollar. Taking into account the inflation report for August, such a likelihood is extremely high. However, the European Central Bank is also no longer sitting on the sidelines. It sticks to aggressive tightening, narrowing the key rate gap with the Fed. It may support the euro in the long term. Besides, risk sentiment is likely to improve as well. The recent COT report unveiled that the number of long non-commercial positions climbed by 2,501 to 207,778, while the number of short non-commercial positions slid by 22,011 to 219,615. At the end of the week, the total non-commercial net position remained negative but rose slightly to -11,832 from -36,349. It indicates the continuation of the upward correction and traders' attempt to find out the bottom. The weekly closing price advanced to 0.9980 from 0.9917.
Signals of indicators:
Moving Averages
Trading is performed below the 30- and 50-day moving averages. It means that bears are trying to regain control over the market.
Note: The period and prices of moving averages are considered by the author on the one-hour chart, which differs from the general definition of the classic daily moving averages on the daily chart.
Bollinger Bands
If the price declines, the lower limit of the indicator located at 0.994 will act as support. In case of a rise, resistance could be found at 0.9993, the upper limit of the indicator.
Description of indicators
- Moving average (moving average, determines the current trend by smoothing volatility and noise). The period is 50. It is marked in yellow on the chart.
- Moving average (moving average, determines the current trend by smoothing volatility and noise). The period is 30. It is marked in green on the graph.
- MACD indicator (Moving Average Convergence/Divergence - convergence/divergence of moving averages). A fast EMA period is 12. A slow EMA period is 26. The SMA period is 9.
- Bollinger Bands. The period is 20.
- Non-profit speculative traders are individual traders, hedge funds, and large institutions that use the futures market for speculative purposes and meet certain requirements.
- Long non-commercial positions are the total number of long positions opened by non-commercial
- traders.
- Short non-commercial positions are the total number of short positions opened by non-commercial traders.
- The total non-commercial net position is a difference in the number of short and long positions opened by non-commercial traders.


