


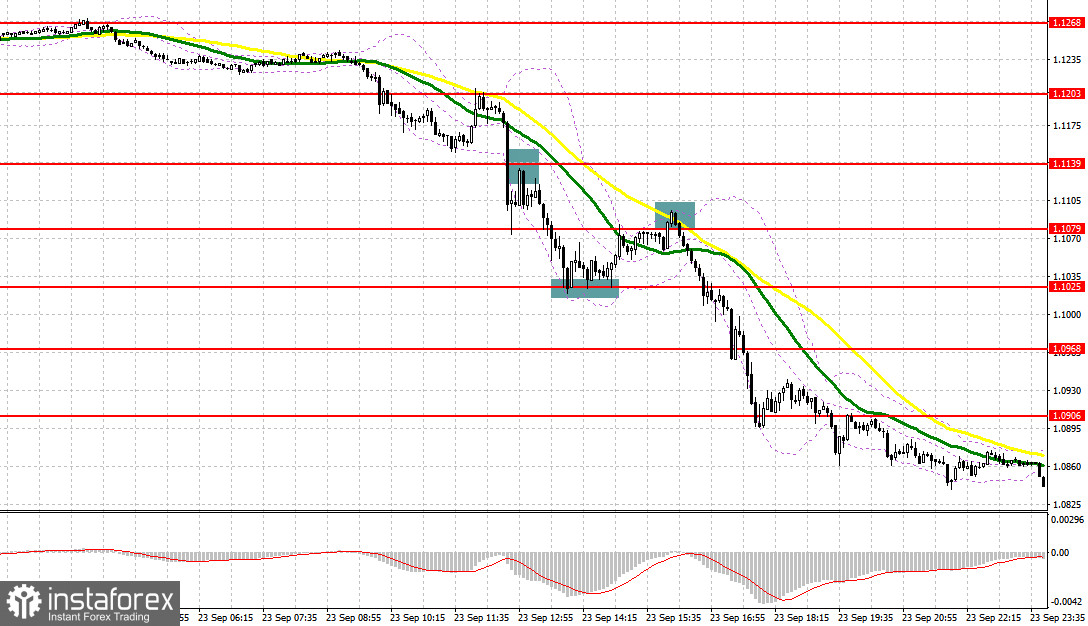
Several market entry signals were formed on Friday. Let's take a look at the 5-minute chart and see what happened. I paid attention to the 1.1168 level in my morning forecast and advised making decisions on entering the market from it. A breakthrough of 1.1215 and a fall to the 1.1168 area was not long in coming, as the pressure on risky assets increased to a maximum. A false breakout at 1.1168 resulted in a buy signal against the trend and a slight 40 point correction. The bears defended the resistance at 1.1139 in the afternoon, but they failed to get a convenient entry point for selling from there. A false breakout at 1.1025, after another collapse of the pound, gave several good buy signals, which again led to a correction by 50 points. And only after the bears brought the pair back to 1.1079, giving another good reason to sell, the pound fell by more than 200 points.
When to go long on GBP/USD:
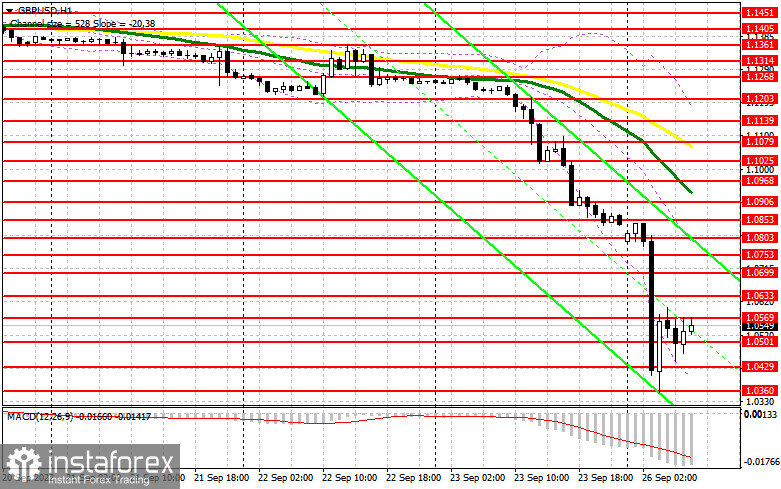
The pair lost another 500 points in today's Asian session and all the reason for the statements made by the British Chancellor of the Exchequer that he plans to cut taxes and provide support to the population of the country. All this is just in time when the Bank of England is trying to fight the 10% inflation rate, which will turn into 13% in the near future. Obviously, such a divergence of rates does not support the British pound, but makes it weaker. Given that there is no reason to buy, I advise you to act very carefully and best of all on a decline. Only a false breakout in the area of 1.0501 will provide a buy signal in order to recover to the resistance of 1.0569. A breakthrough and a downward test of this range may pull speculators' stop-orders behind it, which creates a new buy signal with growth to a more distant level of 1.0633. The farthest target will be the area of 1.0699, where I recommend taking profits. Considering that only the speech of the Bank of England ILC member Silvana Tenreyro is scheduled for today, it is unlikely that anything will help the pound to recover like this.
If the GBP/USD falls and there are no bulls at 1.0501, and most likely it will be so, the pair will be under pressure again, which will open up the prospect of updating the low of 1.0429. I recommend opening long positions on GBP/USD immediately for a rebound from 1.0360, or even lower - around 1.0310, counting on correcting 30-35 points within the day.
When to go short on GBP/USD:
The bears are in full control of the market and the new task is to settle below the level of 1.0500. Of course, the best sell scenario would be a false breakout from 1.0569. This level acts as a kind of upper limit of the short-term horizontal channel, in which the pound has stabilized after the largest Asian sell-off since its similar collapse, when it became known about the coronavirus pandemic in the world. If the pair is under pressure again, the bears' nearest target will be the area of 1.0501. A reverse test from the bottom to the top of this range will provide a good entry point for short positions with goal of a new major sell-off in the 1.0429 area. The farthest target will be a new annual low of 1.360, where I recommend taking profits.
In case GBP/USD grows and the bears are not active at 1.0569, the correction of the pound may lead to the area of 1.0633. Only a false breakout at this level will provide an entry point into short positions, counting on the pair's further downward movement. If traders are not active there, I advise you to sell GBP/USD immediately for a rebound from 1.0699, counting on the pair's rebound down by 30-35 points within the day.
COT report:
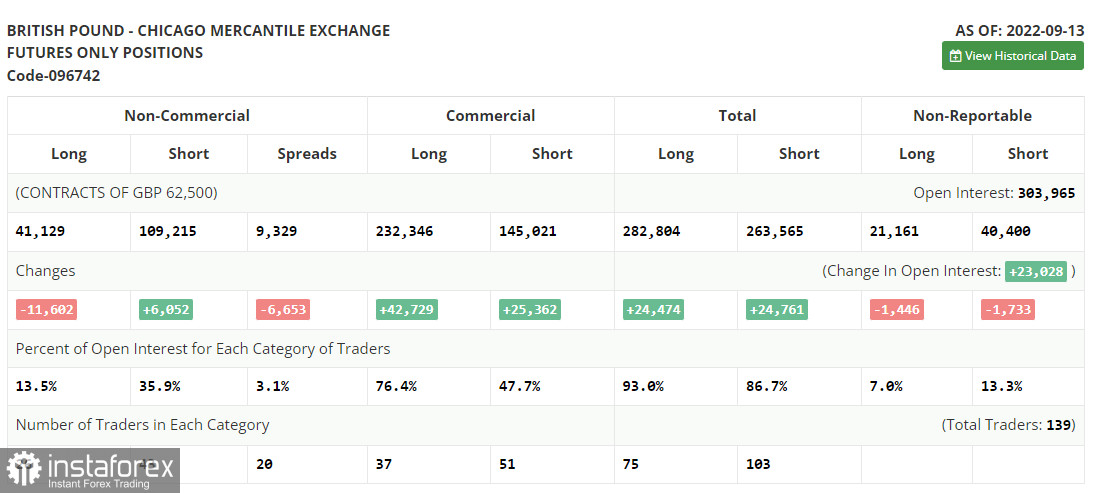
An increase in short positions and a decrease in long ones were recorded in the Commitment of Traders (COT) report for September 13. This once again confirms the fact that the British pound is in a major downward peak, from which it is not as easy to get out as it might seem. This week, in addition to the Federal Reserve meeting, there will also be a meeting of the Bank of England committee, at which a decision will be made to raise interest rates, which will negatively affect the economy, which is gradually sliding into recession, as evidenced by the latest macroeconomic statistics. A recent speech by BoE Governor Andrew Bailey confirms the committee's aggressive intentions. On the one hand, an increase in interest rates should support the pound, but on the other hand, in the face of a sharp slowdown in economic growth and a crisis in living standards in the UK, such measures force them to get rid of the British pound, relying on the US dollar as a safe-haven asset. High U.S. rates are also attracting investors, increasing demand for the U.S. dollar. The latest COT report indicated that long non-commercial positions decreased by 11,602 to 41,129, while short non-commercial positions rose by 6,052 to 109,215, which led to an increase in the negative value of the non-commercial net position to the level of - 68,086 versus -50,423. The weekly closing price collapsed from 1.1504 against 1.1526.
Indicator signals:
Trading is below the 30 and 50-day moving averages, indicating a continuation of the bear market.
Moving averages
Note: The period and prices of moving averages are considered by the author on the H1 hourly chart and differs from the general definition of the classic daily moving averages on the daily D1 chart.
Bollinger Bands
In case of growth, the average border of the indicator around 1.0803 will act as resistance.
Description of indicators
- Moving average (moving average, determines the current trend by smoothing out volatility and noise). Period 50. It is marked in yellow on the chart.
- Moving average (moving average, determines the current trend by smoothing out volatility and noise). Period 30. It is marked in green on the chart.
- MACD indicator (Moving Average Convergence/Divergence — convergence/divergence of moving averages) Quick EMA period 12. Slow EMA period to 26. SMA period 9
- Bollinger Bands (Bollinger Bands). Period 20
- Non-commercial speculative traders, such as individual traders, hedge funds, and large institutions that use the futures market for speculative purposes and meet certain requirements.
- Long non-commercial positions represent the total long open position of non-commercial traders.
- Short non-commercial positions represent the total short open position of non-commercial traders.
- Total non-commercial net position is the difference between short and long positions of non-commercial traders.


