Technical outlook:
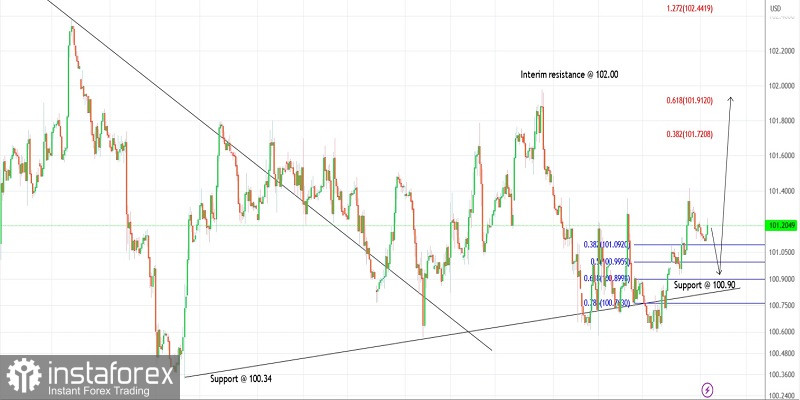
The US dollar index hourly chart has been presented here to have a closer look at the wave structure. The index has been drifting sideways within a triangle consolidation after producing a rally between 100.34 and 101.78 earlier. The triangle consolidation range has been broadly between 100.50 and 101.95 and it looks complete at 100.60 registered on May 08.
If the triangle consolidation terminates at 100.60, the bulls will now hold prices higher and continue pushing higher towards interim resistance, which is seen at 102.00. Please note that potential near-term upside targets are pointing towards 101.5 and 102.45 as projected on the chart here (the red Fibonacci extensions).
The US dollar index has further produced a lower-degree upswing between 100.60 and 101.40. The above rally is now being retraced and might have found interim support at 101.10, which is the Fibonacci 0.382 level of the above rally. Potential remains for a corrective drop to extend through 100.90 before resuming higher again.
Trading idea:
A potential rally against 100.
Good luck!


