


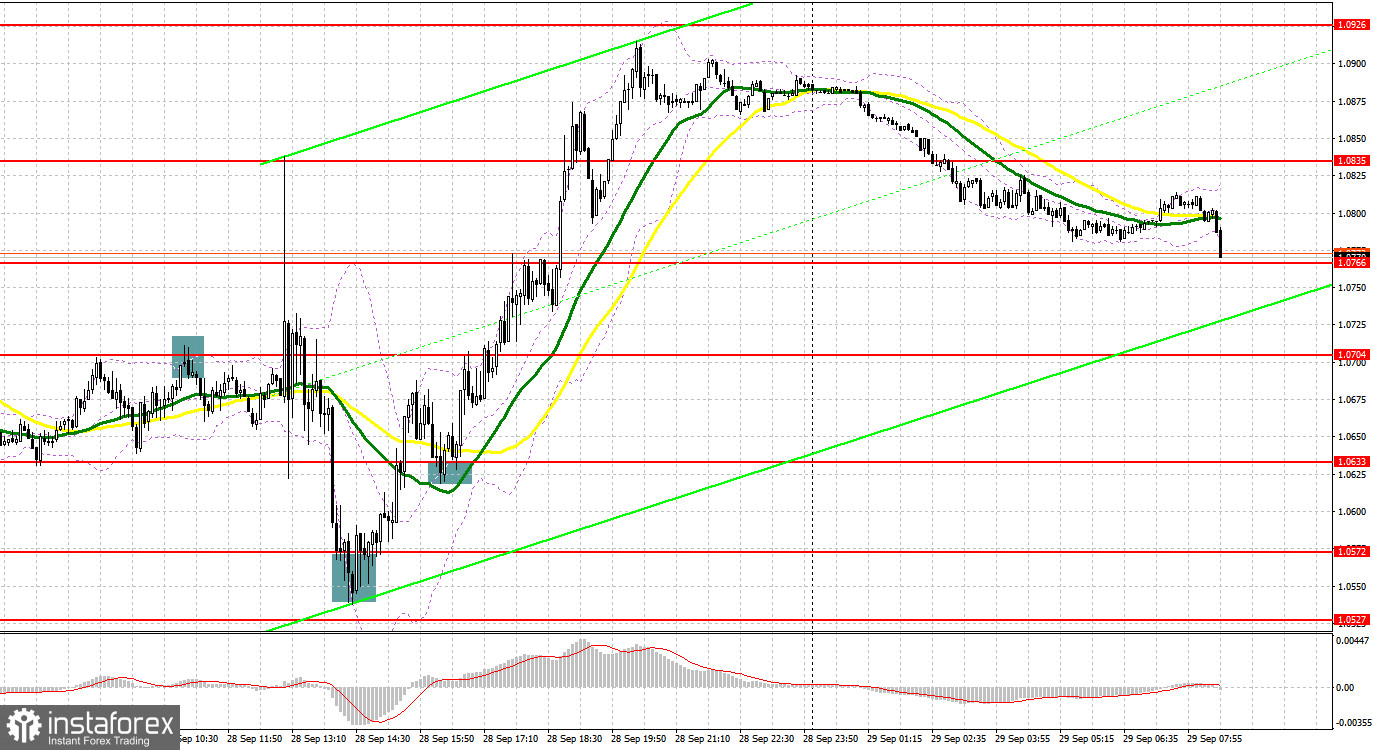
Yesterday, there were several excellent entry points for the pound sterling. Now, let's look at the 5-minute chart and try to figure out what actually happened. A sharp decline in volatility in the first half of the day significantly impacted market sentiment. A false breakout of 1.0704 gave an excellent sell signal in the continuation of the bear market. The pound sterling declined by 30 pips. In the afternoon, the pound sterling regained ground following the news that the Bank of England intervened in the bond market. A buy single appeared after a false breakout of 1.0572. The pair grew to 1.0633. A breakout and a downward test of this level gave an additional buy signal. The pair recovered by more than 300 pips.
Conditions for opening long positions on GBP/USD:
The upward movement bolstered by the BoE's intervention is unlikely to last long. For this reason, I would not recommend traders to increase long positions, expecting a further recovery. Today, Deputy Governor for Markets and Banking Sir David Ramsden is scheduled to deliver a speech. It may shed light on the new steps in the monetary policy of the regulator. His speech could fuel a further upward movement in the pound sterling. If the pair moves down, the optimal scenario for opening long positions will be a false breakout at 1.0738. At this level, the moving averages are passing in positive territory. If this assumption is correct, GBP/USD may rise to 1.0818. A breakout and a downward test of level will force bears to close Stop Loss orders. It will give a new buy signal with the prospect of an increase to 1.0899. The main task of bulls is to push the pair to 1.0958 where I recommend locking profits. If the political situation in the UK worsens, the pound sterling is likely to dip. If bulls show no activity at 1.0738, the pressure on the pair will return. As a result, it may slide down to a low of 1.0676. You can open long positions on GBP/USD at s bounce from 1.0617 or 1.0545, keeping in mind an upward intraday correction of 30-35 pips.
Conditions for opening short positions on GBP/USD:
Bears are trying to regain control but the BoE intervention helped the pound sterling rebound. The optimal scenario for opening short positions will be a false breakout of 1.0818. This level acts as an intermediate resistance. Bears are likely to take control if they push the price below 1.0738 and the moving averages. An upward test of this level will give a good entry point into short positions with a prospect of a drop to 1.0676 and 1.0617. A more distant target will be a low of 1.0545 where I recommend locking in profits. However, the quotes may decrease to that level only if political woes in the UK intensify. If GBP/USD grows and bears show no energy at 1.0818, a downward correction to 1.0899 may occur. A sell signal is likely to appear only after a false breakout of this level, pushing the pair down. If bulls and bears do not tussle for this level, you can sell GBP/USD at a bounce from 1.0958, keeping in mind a downward intraday correction of 30-35.
COT report
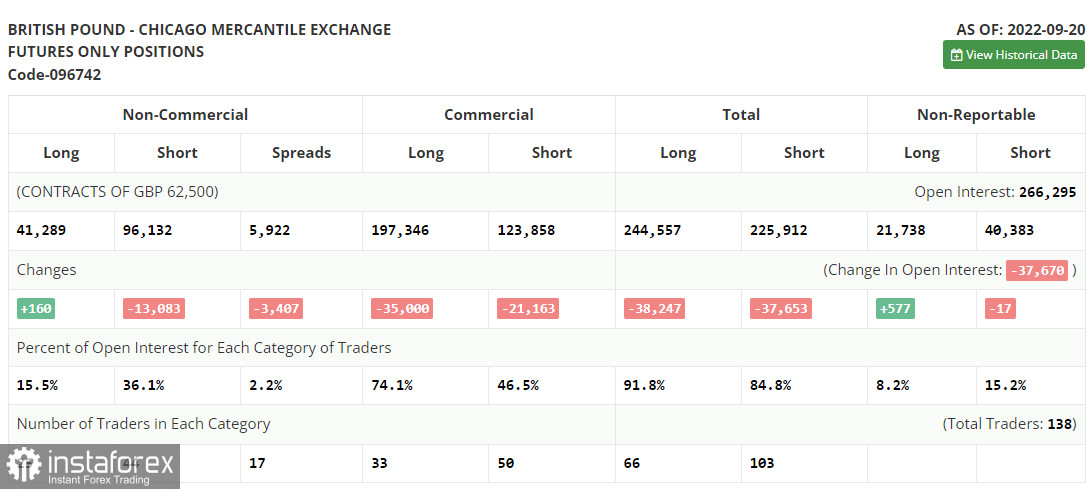
The COT report (Commitment of Traders) for September 20 logged an increase in long positions and a contraction in short ones. However, this report does not reflect the actual market situation. For this reason, I would not advise you to pay great attention to it. There have been lots of changes in just a few days in the UK. They are now setting the trend. Last week, the Bank of England raised interest rates by only 0.5%. It appears the central bank has already regretted this decision. After that, the HM Treasury announced tax cuts to help households to cope with high energy prices and stimulate the economy. However, it could fuel inflation which the Bank of England is still unable to tame. As a result, traders rushed to sell off the pound sterling. It took a nosedive by almost 1,000 pips in two days. Investors took advantage of this drastic decline and bought it at a lower price. So, the pound sterling regained ground. However, it is difficult to say that it has already found the bottom. The UK is going to publish many fresh economic reports this week, which could escalate pressure on the pounds sterling. The latest COT report revealed that the number of long non-commercial positions increased by 160 to 41,289, while the number of short non-commercial positions dropped by 13,083 to 96,132. It led to s small decrease in the negative delta of the non-commercial net position to -54,843 versus - 68,086. The weekly closing price amounted to 1.1392 vs. 1.1504.
Signals of technical indicators
Moving averages
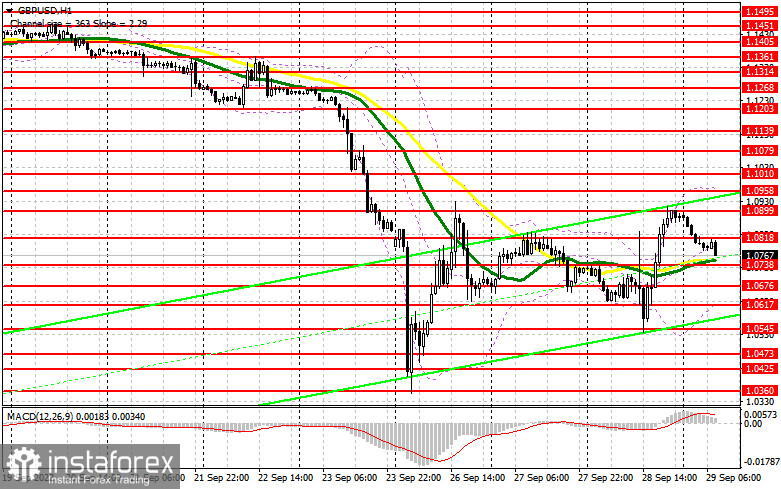
EUR/USD is trading above 30- and 50-period moving averages, indicating an upward correction.
Remark. The author is analyzing the period and prices of moving averages on the 1-hour chart. So, it differs from the common definition of classic daily moving averages on the daily chart.
Bollinger Bands
If GDP/USD grows, the indicator's average border at 1.0958 will act as resistance.
Definitions of technical indicators
- Moving average recognizes an ongoing trend through leveling out volatility and market noise. A 50-period moving average is plotted yellow on the chart.
- Moving average identifies an ongoing trend through leveling out volatility and market noise. A 30-period moving average is displayed as the green line.
- MACD indicator represents a relationship between two moving averages that is a ratio of Moving Average Convergence/Divergence. The MACD is calculated by subtracting the 26-period Exponential Moving Average (EMA) from the 12-period EMA. A 9-day EMA of the MACD called the "signal line".
- Bollinger Bands is a momentum indicator. The upper and lower bands are typically 2 standard deviations +/- from a 20-day simple moving average.
- Non-commercial traders - speculators such as retail traders, hedge funds and large institutions who use the futures market for speculative purposes and meet certain requirements.
- Non-commercial long positions represent the total long open position of non-commercial traders.
- Non-commercial short positions represent the total short open position of non-commercial traders.
- The overall non-commercial net position balance is the difference between short and long positions of non-commercial traders.


