


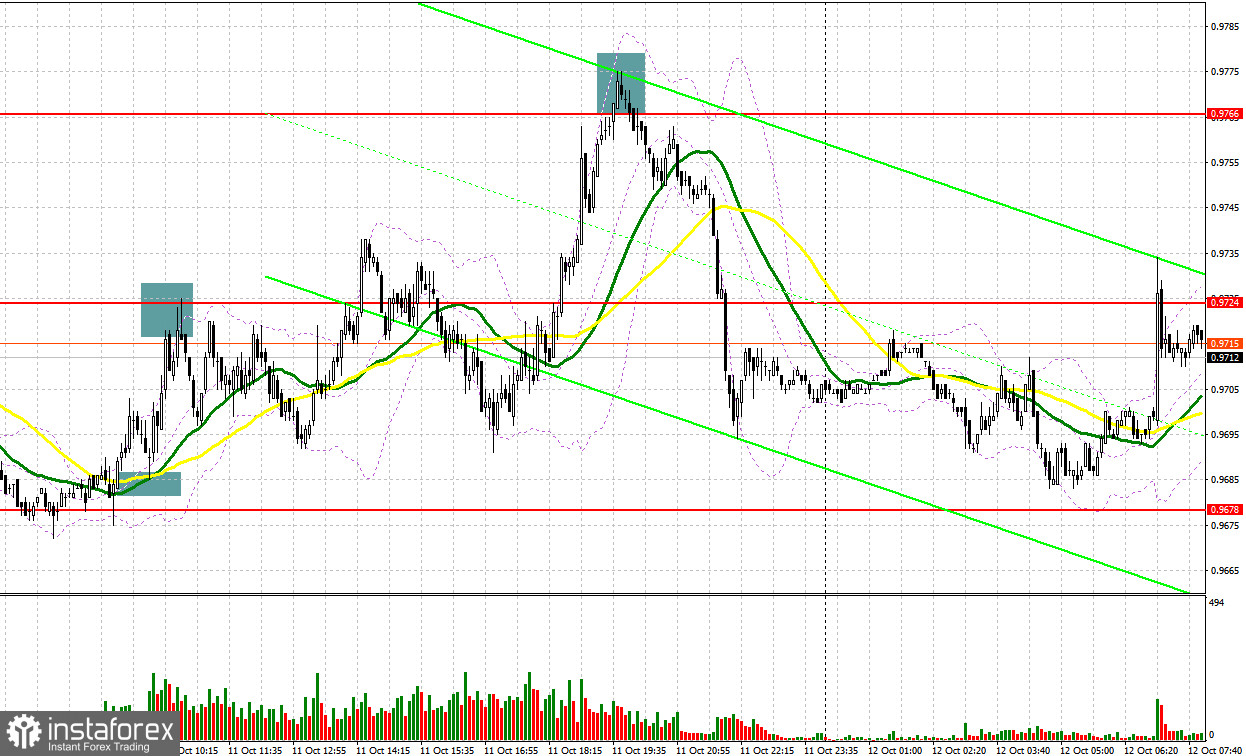
Several excellent market entry signals were formed yesterday. Let's take a look at the 5-minute chart and see what happened. I paid attention to the 0.9685 level in my morning forecast and advised making decisions on entering the market there. As a result of the decline to the area of 0.9685, the bulls became active and managed to form a false breakout there, which led to a signal to buy the euro. At the moment, the pair went up about 40 points. Then there was a test and a false breakout at 0.9724, which led to a sell signal, as a result of which the downward move was about 30 points. The bulls tried to get to the weekly highs in the afternoon, but an unsuccessful attempt to consolidate above 0.9766 created an excellent entry point for selling EUR/USD. As a result, the pair collapsed by more than 70 points.
When to go long on EUR/USD:
Today the pair may continue trading in a horizontal channel with attempts to rise above the intermediate resistance at 0.9731, formed at the end of yesterday. Only the August report on the change in the volume of industrial production of the eurozone will be released, which will not have any significance for determining the further direction of EUR/USD. European Central Bank President Christine Lagarde's statements may indirectly affect the euro, as she is not expected to tell us anything new. For this reason, I advise you to stick to the previous strategy and rely on the next levels. In case the pair falls, forming a false breakout in the area of 0.9684 will become a reason for building up long positions with the prospect of going back to 0.9731. It will be possible to talk about the bulls' attempts to regain control, by analogy with yesterday, only after a breakthrough of 0.9731 and a test from the top to the bottom of this range, which will hit the stops of speculative bears betting on a further fall in the euro and counting on strong inflation in the US. This creates another signal to open long positions with the possibility of a surge upwards to the area of 0.9774, from which the euro was actively sold yesterday. Therefore, even consolidating above this level will not lead to a change in the market direction. Only a breakthrough above 0.9774 and an update to 0.9809 resistance would jeopardize the bear market seen of late. A more distant target will be resistance at 0.9841, where I recommend taking profits.
If the EUR/USD falls and there are no bulls at 0.9684, the pressure on the euro will only increase. This will lead to a fall to the 0.9638 area. The optimal solution for opening long positions there would be a false breakout. I advise you to buy EUR/USD immediately on a rebound only from 0.9592, or even lower - in the area of 0.9540, counting on an upward correction of 30-35 points within the day.
When to go short on EUR/USD:
The bears made their presence felt yesterday afternoon, which clearly shows the market's mood ahead of important inflation data in the US, which is expected tomorrow. It is unlikely that anyone will seriously buy the euro before this kind of data, so in case EUR/USD grows, I advise you to open short positions in hopes of restoring market equilibrium. The optimal scenario for opening shorts would be forming a false breakout at the level of 0.9731, which was formed at the end of yesterday, which will provide an excellent entry point into shorts, allowing for a sharper movement of the pair down to the 0.9684 area, a level that has not been broken through for several days. Consolidating below this range, as well as a reverse test from the bottom up, will provide a reason to sell EUR/USD further in order to demolish the bulls' stop orders and a larger fall to the 0.9638 area. The farthest target will be the area of 0.9592, where I recommend taking profits.
If EUR/USD moves up during the European session, as well as the absence of bears at 0.9731, the demand for the pair will increase, which will lead to a more powerful upward correction. In this case, I advise you not to rush into selling: I recommend opening shorts only if a false breakout is formed at 0.9774, by analogy with what I analyzed above. You can sell EUR/USD immediately for a rebound from a high of 0.9809, or even higher - from 0.9841, counting on a downward correction of 30-35 points.
COT report:
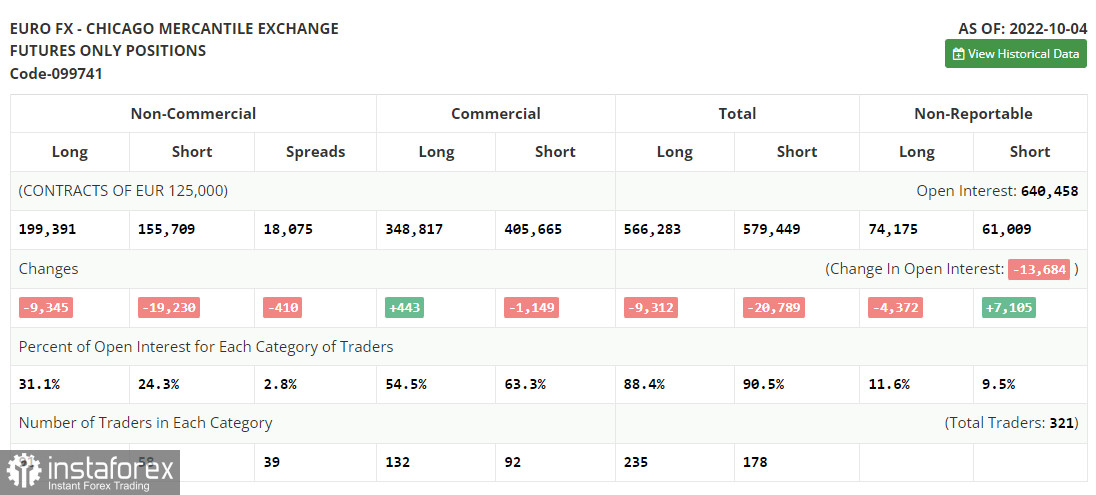
The October 4 Commitment of Traders (COT) report logged a sharp decline in both short and long positions. Many investors and major players now prefer to take a wait-and-see attitude, especially given the extent to which geopolitical tensions have reached. Against this background, there is no doubt about the demand for the US dollar, and if we add here the latest data on the US labor market and the expected September inflation: we can confidently say that the euro has not yet reached final lows against the US dollar and that in the near future we can expect the final annual sale of risky assets. The COT report indicated that long non-commercial positions decreased by 9,345 to 199,391, while short non-commercial positions decreased by 19,230 to 155,709. At the end of the week, the total non-commercial net position remained positive and amounted to 43,682 against 33,797. This indicates that investors are taking advantage of the moment and continue to buy cheap euros below parity, as well as accumulate long positions, counting on the end of the crisis and the pair's recovery in the long term. The weekly closing price recovered and amounted to 1.0053 against 0.9657.
Indicator signals:
Moving averages
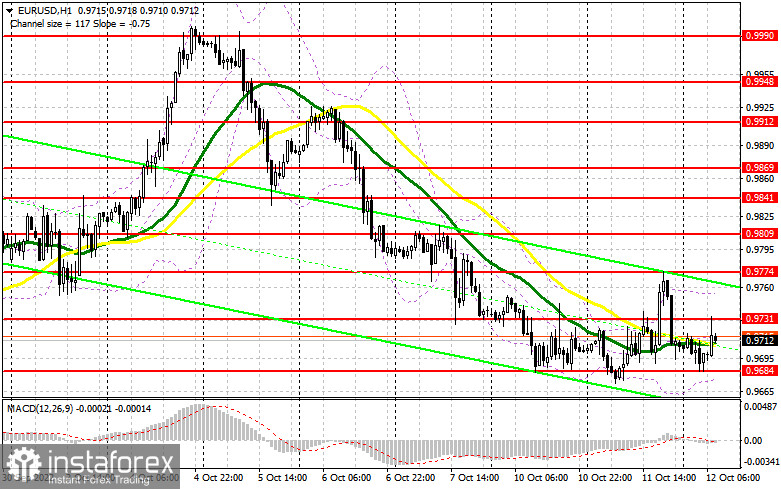
Trading is carried out in the area of 30 and 50-day moving averages, which indicates the sideways nature of the market.
Note: The period and prices of moving averages are considered by the author on the H1 hourly chart and differs from the general definition of the classic daily moving averages on the daily D1 chart.
Bollinger Bands
In case of growth, the upper border of the indicator in the area of 0.9760 will act as resistance. In case of a decrease, the lower border of the indicator around 0.9680 will act as support.
Description of indicators
- Moving average (moving average, determines the current trend by smoothing out volatility and noise). Period 50. It is marked in yellow on the chart.
- Moving average (moving average, determines the current trend by smoothing out volatility and noise). Period 30. It is marked in green on the chart.
- MACD indicator (Moving Average Convergence/Divergence — convergence/divergence of moving averages) Quick EMA period 12. Slow EMA period to 26. SMA period 9
- Bollinger Bands (Bollinger Bands). Period 20
- Non-commercial speculative traders, such as individual traders, hedge funds, and large institutions that use the futures market for speculative purposes and meet certain requirements.
- Long non-commercial positions represent the total long open position of non-commercial traders.
- Short non-commercial positions represent the total short open position of non-commercial traders.
- Total non-commercial net position is the difference between short and long positions of non-commercial traders.


